
Cryptocurrency projects are often judged by their token prices, which can fluctuate dramatically based on market sentiment and real-world developments. However, one key factor that may influence token values is the activity and engagement of the developers behind the projects. This work aims to analyze the relationship between GitHub developer metrics and token prices for six prominent cryptocurrency projects: Ocean Protocol, Bittensor, Fetch.AI, Oraichain, Numerai, and SingularityNET. By examining data points such as commit frequency, repository creation, and other indicators of developer activity, we will uncover potential correlations with token price movements.
the outline of this blog is as follow:

Dataset Overview
for each of prementioned token (Ocean, Numerai, Fetch-ai, Bittensor, Singularity and Oraichain ) the provided dataset included four distinct data :
- github commits dataset (json)
- github issues dataset (json)
- github repos dataset (json)
- historical token price (csv)
the following images shows the size of each dataset :
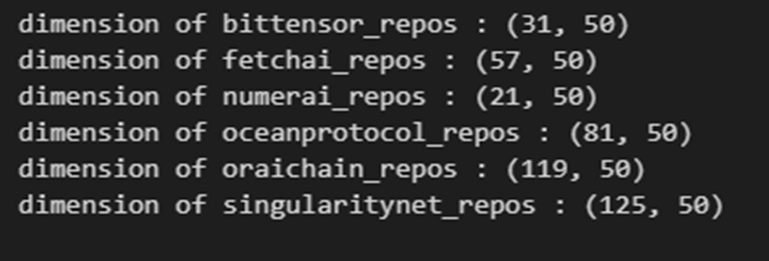
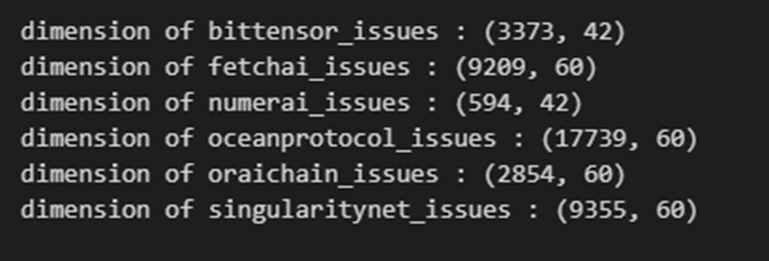
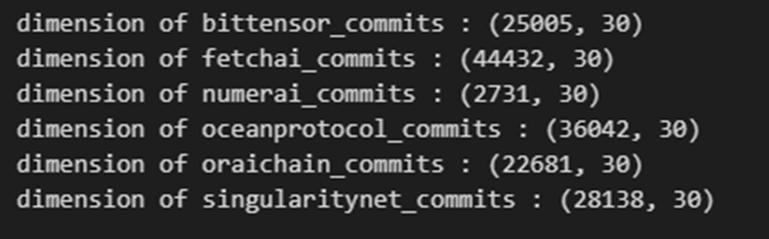
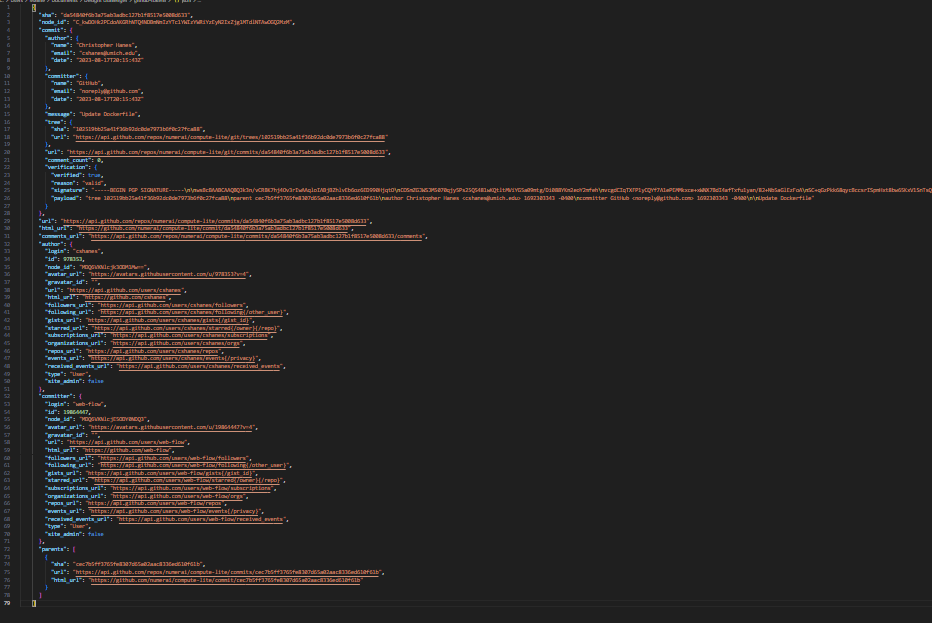
Looking and comparing these images one can realize that Numerai Community is relatively the smallest and least active, however in order to identify the most active communities we should delve into the data more deeply. Following is one particular sample of Numerai commit dataset, I had to shrink the font size to be able to show it on screen. As you can see the data is nested and unstructured, Moreover, for some samples there may be some missed keys and values which indicates that the fields are not constant in each sample. In order to be able to work on data and analyze it we must convert it to structured data and flatten the nested features.
Data Pre-Processing
Preprocessing stage is to flatten the data and make it more structured and analyzable. This part consists of multiple steps:
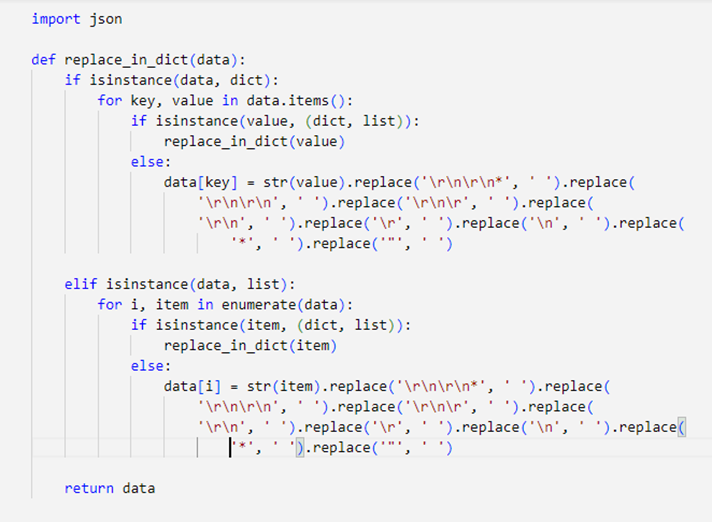
- Convert json files to csv: in the first step json files converted to flatten csv files. Since the json files had irregular nested architecture, within the following recursive function we obtained a regular nested architecture and then using df = pandas.json_normalize(result) we flatten the data and turn it to csv.
- Remove URL columns : Most column of the obtained csv files had URL data which were useless in analysis. Therefor we removed all these column to achieve a lighter and useful dataset.
- Encoding the categorical values: values like author.type and committer.type (commits), owner.type (repo), user.type (issue) , has_issues , archived, has_projects , has_wiki , has_pages , has_discussions, is_template had categorical values. These values converted to numeric values.
- Categorical values of author.type , committer.type , owner.type , user.type columns : [ ‘User‘ , nan , ‘Bot’ , ‘Organization’ ]
- We then converted these values to Boolean type with {1: User, org} {0: nan , Bot}
- Boolean values of has_issues , archived , has_projects , has_wiki , has_pages , has_discussions, is_template columns : [ ‘True’ , ‘False’ ]
- We then convert it to Boolean type with {1: True} {0: False}
- Grouping the remaining columns: The fields of datasets were not recorded daily and their time interval was irregular, because of that we grouped the dataset records daily to have a unique date time in dataset. We also grouped repos and issues based on created_at and grouped commits based on commit.committer.date. Here are the more specific details :
- For all kind of ‘id’ type columns: We count non-zero values to obtain the number of individuals
- (lambda x: np.count_nonzero(np.unique(x)))
- ‘repo.size’, ‘comments’, ‘reactions.total_count’: We applied sum operation in our aggregation function
- All count numbers like ‘stargazers_count’ , ‘watchers_count’ , ‘forks_count’ , … : We applied sum operation in our aggregation function ,
- For some boolean values like ‘has_issues’, ‘user_type’, ‘has_pages’ , …: We calculated the portion of True values, by counting them and dividing to the number of samples
- (lambda x: (x == 1).sum() / len(x))
- For all kind of ‘id’ type columns: We count non-zero values to obtain the number of individuals
After doing so , we achieved a flatten data with only useful features where we stored them in csv files. For more clarification, here we show a few samples of the corresponding csv datasets for Bittensor token :
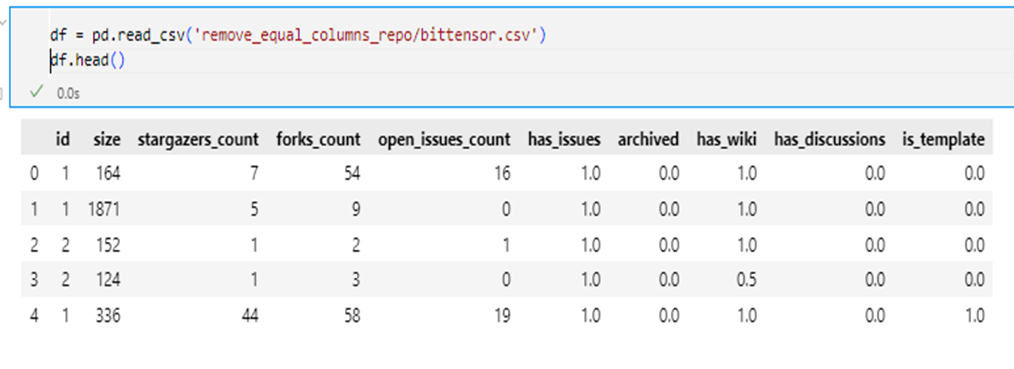
The above image shows the bittensor repos dataset. Repositories dataset for all other tokens also consists of these 9 columns , however the number of sample in repos dataset is low and may lead to inaccurate trends analysis. id column indicates the number of repos per day.
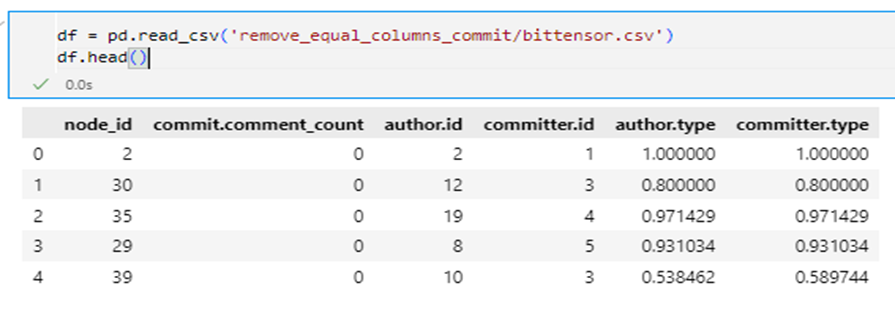
This shows a few samples of bittensor commits dataset. Node_id , author_id and committers_id show the number of commits, commit authors and commit committers per day respectively.
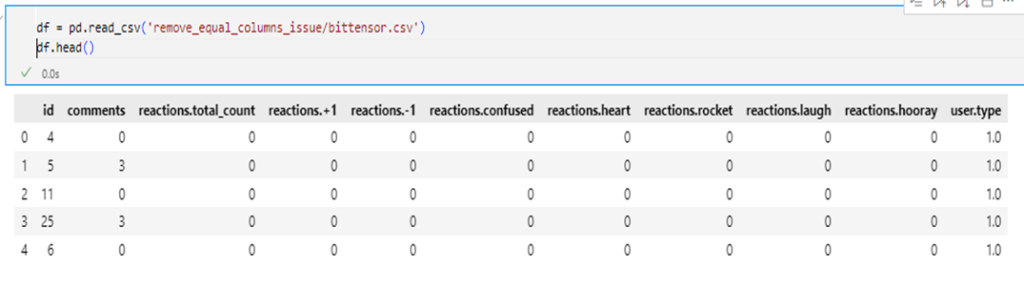
This figure shows the bittensor issue dataset. As can be seen the reaction columns are sparse so they will be ignored in our analysis and only the 4 columns of id , comments, total_reaction and user.type will be analyzed, where id is the number of issues per day
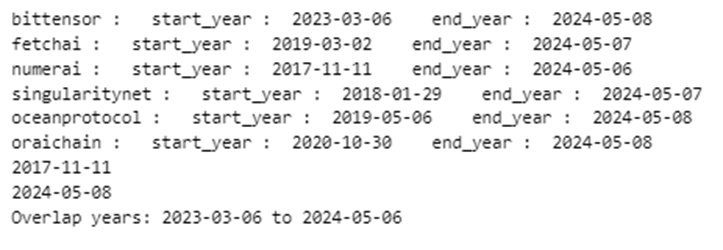
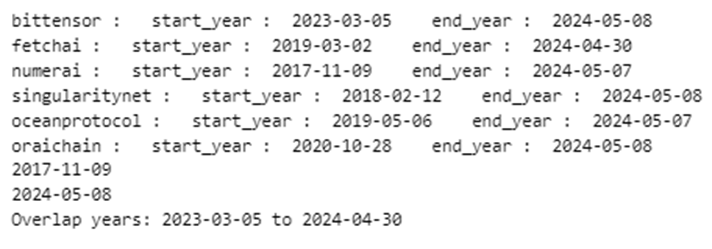
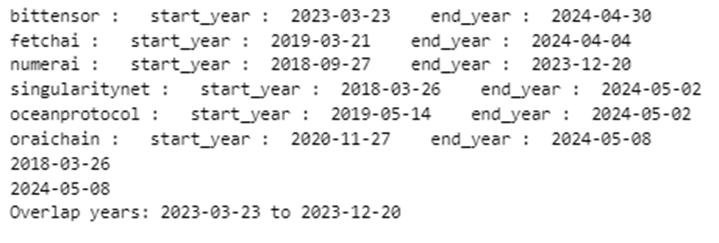
The above three images illustrate start date and end date of each three dataset (issues, commits, repos from left to right respectively) based on the earliest and the latest sample. Looking at these images we can see that Bittensor has the least amount of data and has been founded after all other tokens in 2023. On the other hand Numerai is the oldest token which is founded in 2017. Time Overlap for all these six tokens and for each dataset is as follow, which is almost a year (repos 8 months , commits and issues 13 months)
- For repositories 2023-3 to 2023-12
- For commits 2023-3 to 2024-04
- For issues 2023-03 to 2024-05
EDA
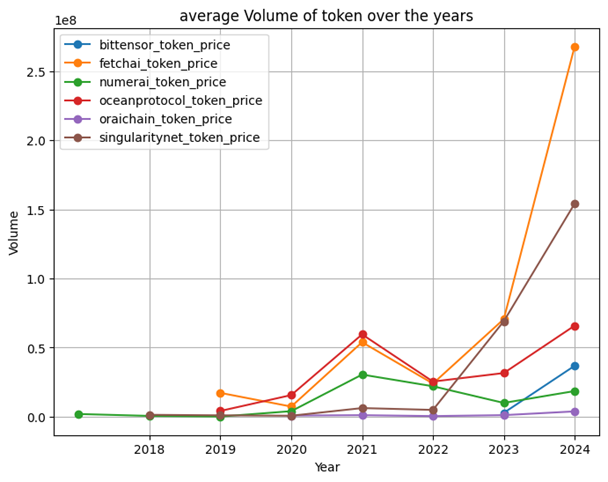
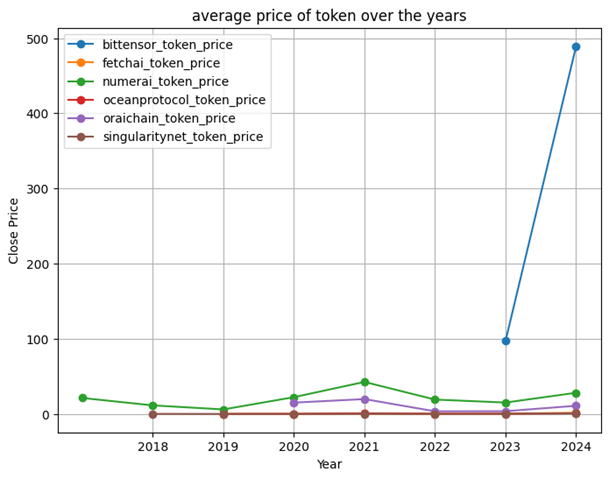
Looking at average price of tokens, we can see an interesting point, while Bittensor is the newest token but it’s average price has been increased very rapidly and has reached from 100 $ to 450$ just in less than a year which means nearly 350% growth ! , The other 5 tokens haven’t changed significantly and their changes are steadily. However the volume plot illustrates more rational trend… . . Fetchai and Singularitynet are the leaders in this case with more than 250 millions and 150 millions of transaction volume in 2024. Ocean Protocol had the maximum amount of transactions in 2021 and slightly surpassed the others. Oraichai and numerai stand at the last of the list with less than 50 million
Rank the Projects
Repos
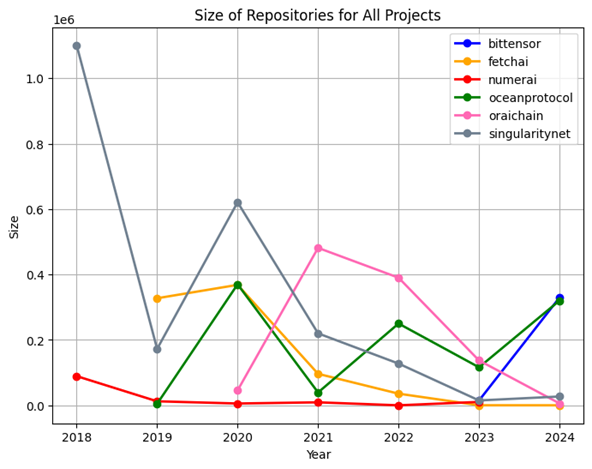
To compare the projects based on Repos we considered and studied different factors of repos like the size of repos , number of repos , number of fork counts and number of open issues in each repos. Below you can see the line charts for each of these metrics comparing all project together.
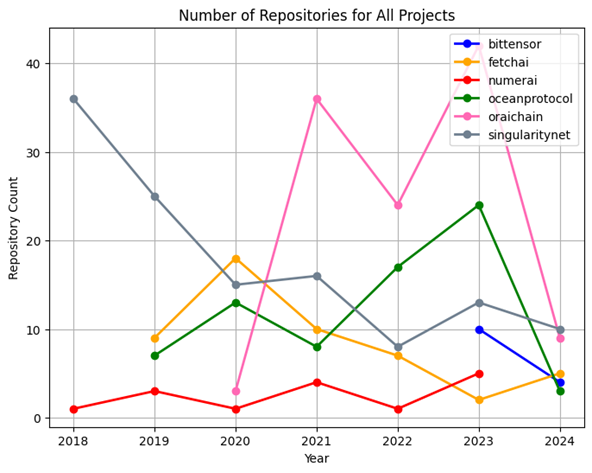
- Repo Count: Oraichain leads in the number of repositories, showing significant fluctuations over the years, maintaining the top position from 2021 to 2023. In contrast, Singularity’s repository count started at 36 in 2018 but has consistently declined. Numerai has the least number of repositories, remaining below 10 with no notable changes throughout the years.
- Repo Size: Singularity had the largest repository size in 2018, reaching approximately 1 million, but this size decreased in subsequent years. No other tokens matched this size. The other tokens exhibited fluctuations in repository size, while Numerai consistently maintained the smallest size without any fluctuations.
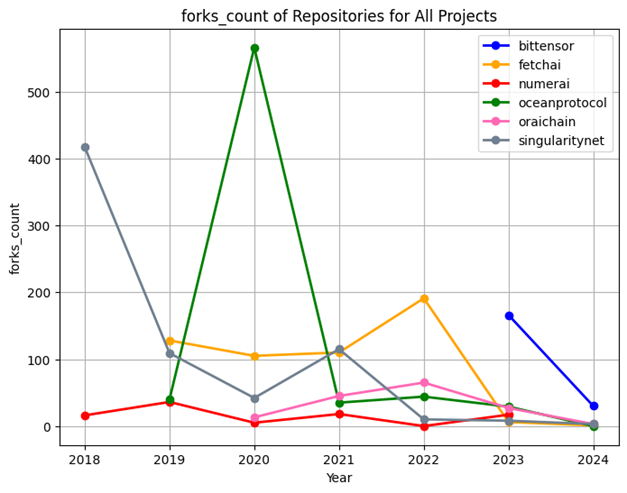
- Fork Counts: Ocean peaked in 2020 with over 500 forks but saw a drastic drop to below 100 the following year. Singularity held second place with more than 417 forks in 2018, which also declined thereafter. The remaining tokens consistently had fewer than 200 forks during this period.
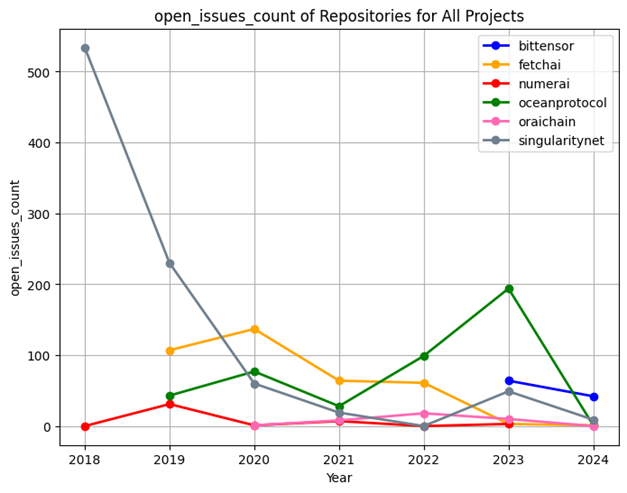
- Open Issues: Singularity recorded the highest number of open issues in 2018, exceeding 500, but this number decreased in later years. Ocean experienced a spike in open issues in 2023 with 194, while other tokens showed gradual fluctuations without significant changes.
Commits
As before, to compare the projects based on Commits we considered different metrics of commits like the number of commits, the number of comments per commit and the number of authors. Here is the line chart comparison:
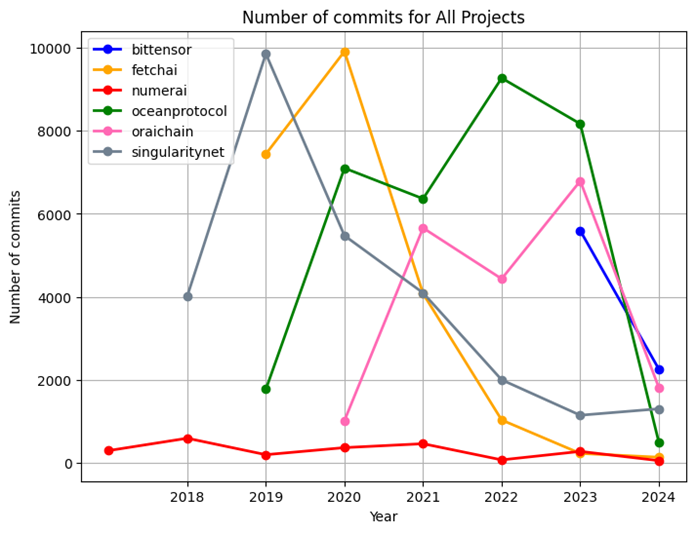
- Number of Commits: Singularity and Fetch.ai peaked at around 10,000 commits in 2019 and 2020, respectively, but both saw a significant decline, dropping to below 2,000 in 2024. Ocean also had a notable peak with 9,268 commits in 2022 and 8,100 in 2023, but it too experienced a decline in 2024. Numerai consistently ranks lowest in this metric, showing no changes over the years.
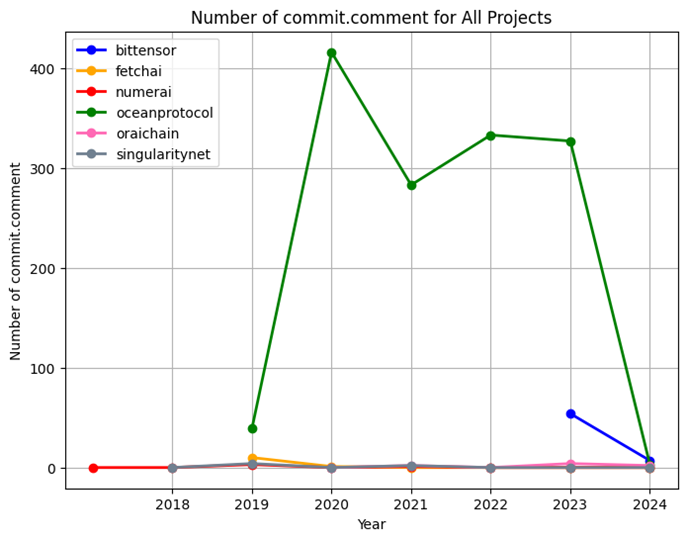
- Comments per Commit: Ocean significantly outperformed other tokens with a maximum of 416 comments per commit in 2020 and 317 in 2023. In contrast, the other tokens recorded nearly zero comments per commit, which may reflect their lower publicity status.
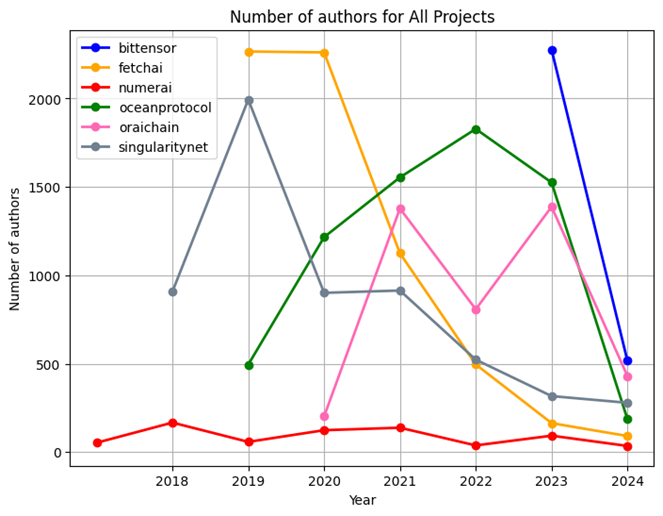
- Number of Authors: Except for Numerai, which has been the weakest across all activity metrics, other tokens demonstrated a considerable number of authors. Bittensor and Fetch.ai had over 2,000 authors each, while Singularity and Ocean had more than 1,500 authors. However, the number of authors for all tokens declined to below 500 by 2024.
Issues
We considered different metrics of issues like the number of issues, the number of comments per issue and the number of reactions to each issue , to compare the projects based on issues . Here is the line chart comparison:
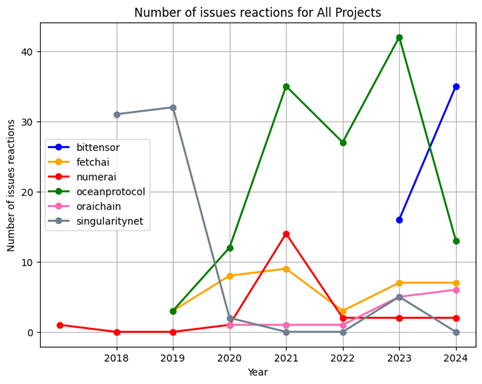
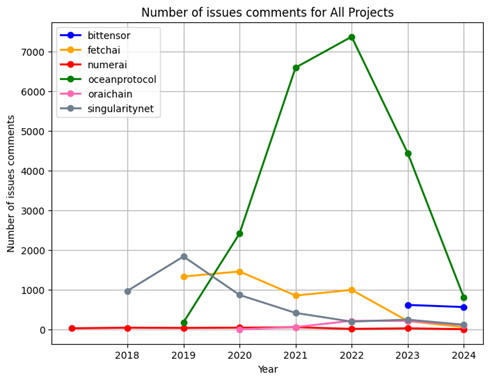
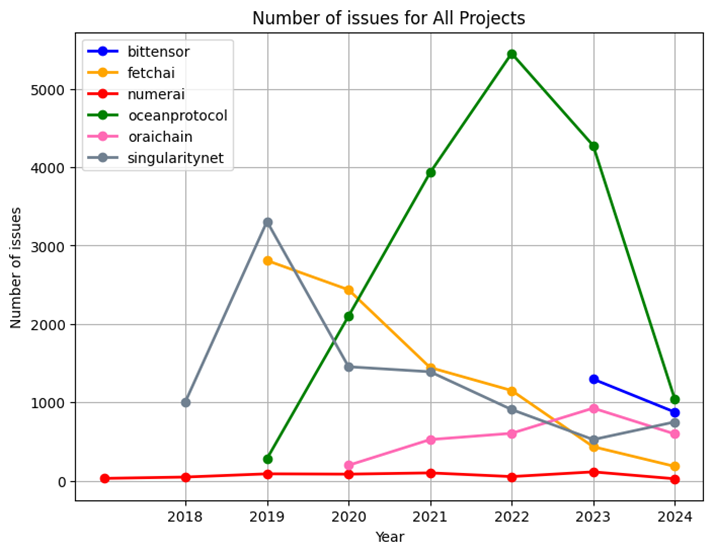
- Issue Activity: Ocean leads the projects with over 5000 issues in 2022, showing a steady increase from 2019 before a decline began. Singularity had more than 3000 issues in 2019, but its numbers decreased subsequently. Numerai demonstrated weak performance in issue activity.
- Community Engagement: Ocean not only has the highest number of issues but also excels in community engagement, with over 7000 comments recorded in 2022, while reactions to issues were notably low, totaling less than 100 reactions.
- Comparative Analysis: Following Ocean, Singularity and Fetch.ai were the next most active projects regarding comments. This indicates a robust community interaction around Ocean compared to others.
Rank the most Active Developers
We rank developers based on the number of commits that each developer has pushed in each crypto project. To do so we counted the number of commits in each months written by each developer. We did it with python group-by function on commiter.id feature respect of the time. This gives us the accumulated number of commits of each developer in each year.
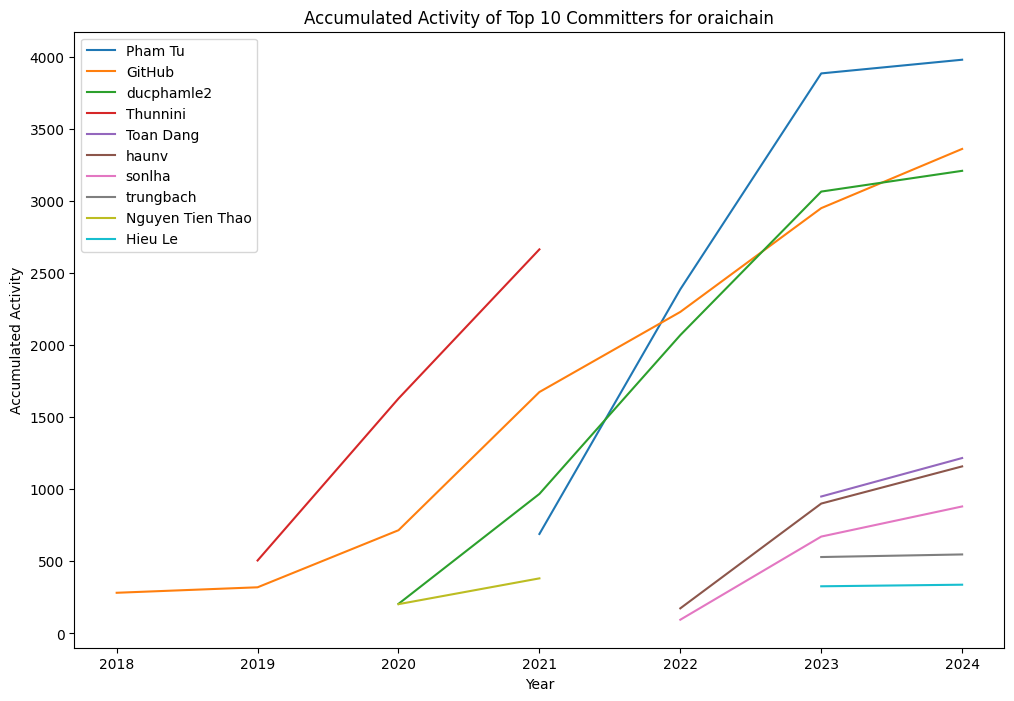
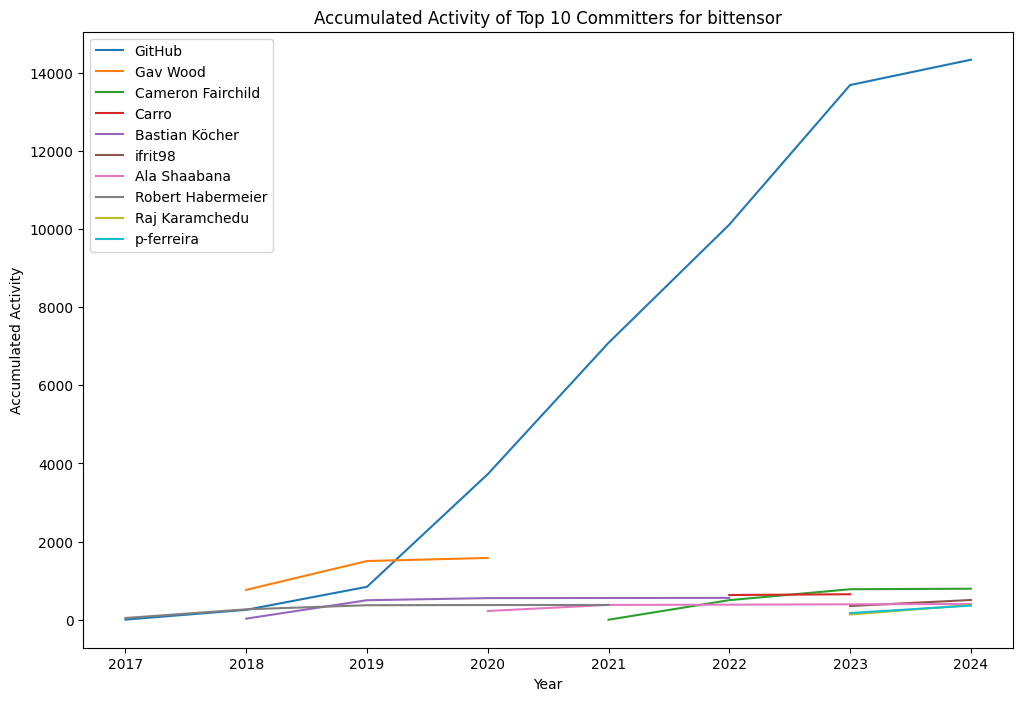
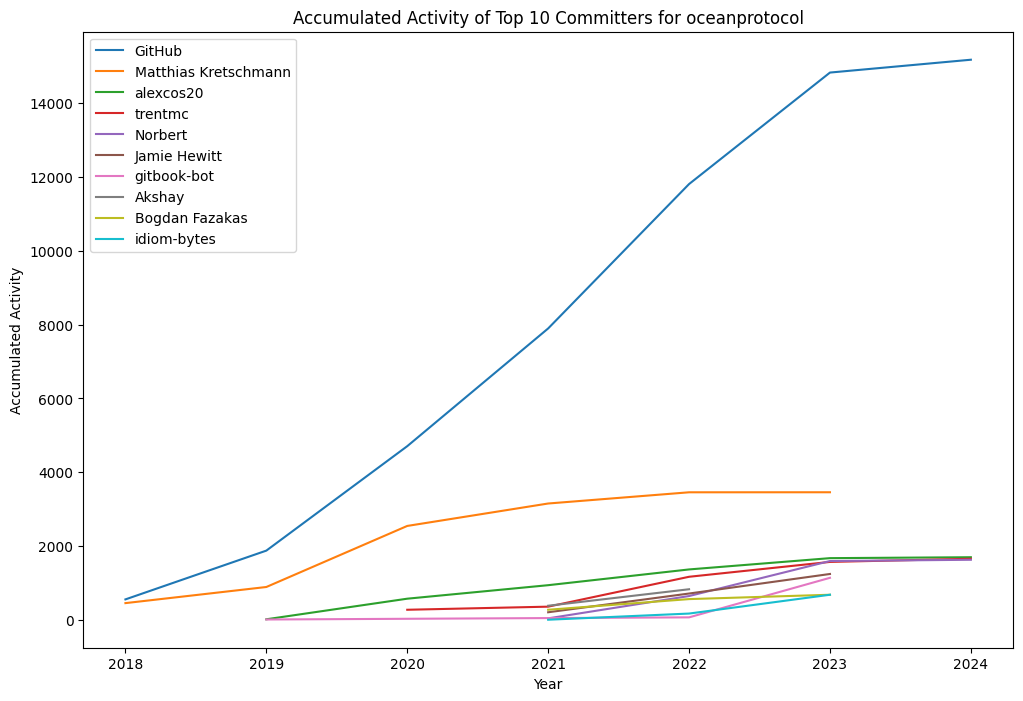
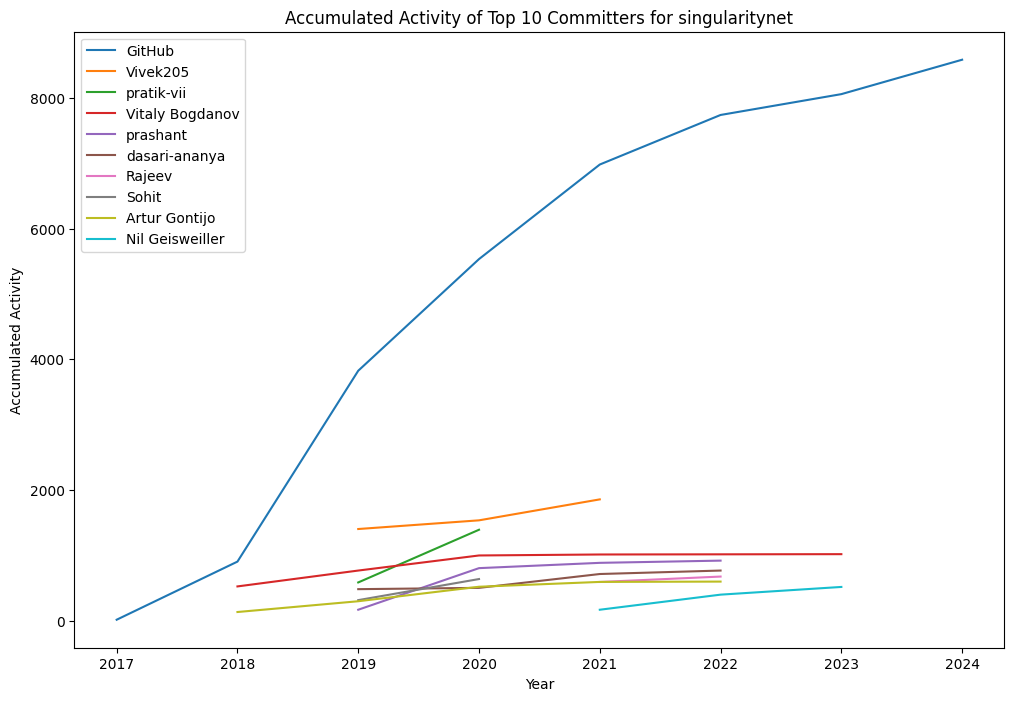
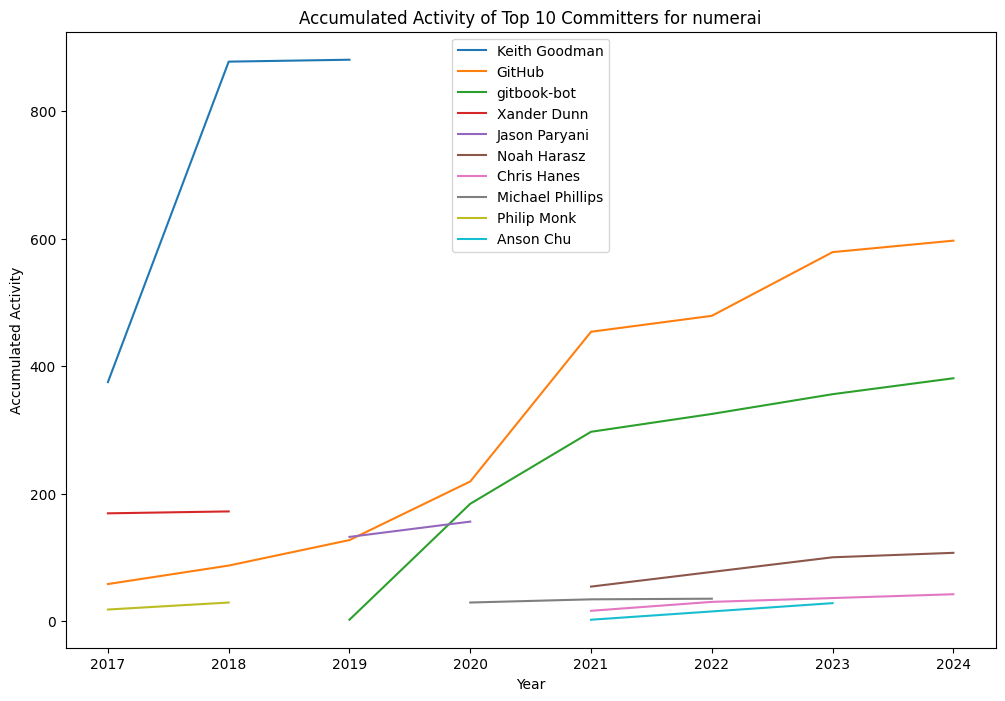
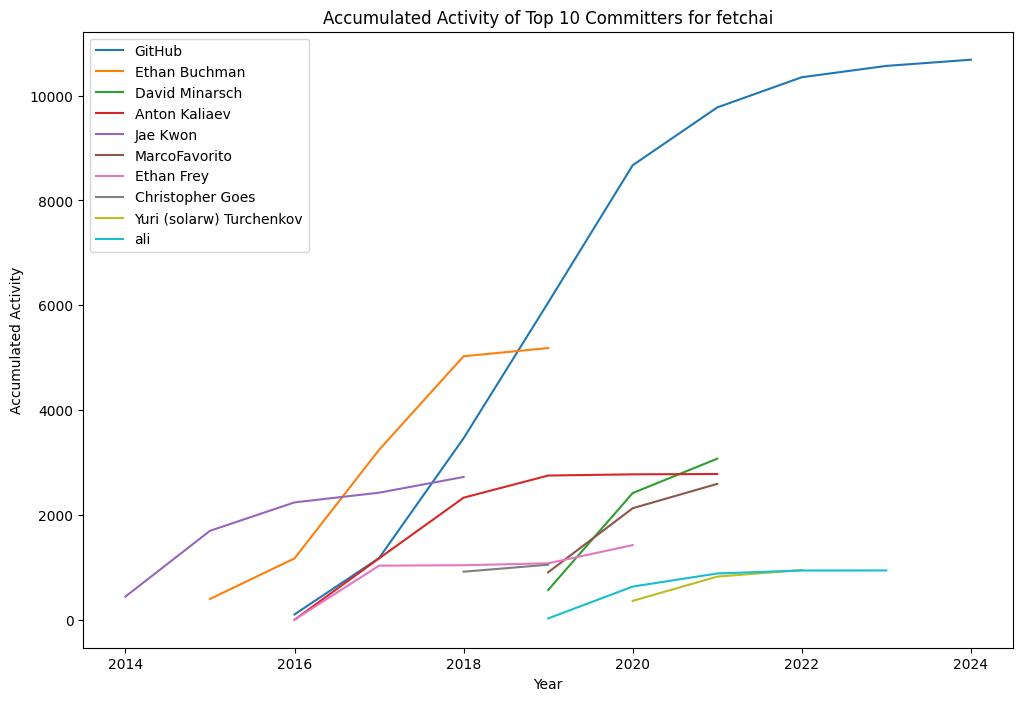
These figures shows the top 10 most active developers for each projects over the years. The y-axis shows the accumulated number of commits that each author has committed. Note that the number of commits are accumulated means that the numbers in each year are added together to reflect the total commits made over time, rather than just showing the commits made within a single year.
- General View
- GitHub is consistently one of the top contributors across projects, which likely represents automated commits or system-generated changes
- Most projects show increased development activity between 2018-2024, suggesting the crypto ecosystem was quite active during this period
- Oraichain:
- Pham Tu emerged as a super active developer around 2021-2022, with a sharp increase in contributions
- Several developers like ducphamle2 and Thunnini have maintained steady contribution rates
- The project seems to have good developer diversity with 10+ active contributors
- Oceanprotocol:
- This project has the highest number of accumulated commits among all five
- The GitHub account dominates with over 14,000 commits
- Matthias Kretschmann is the second most active individual contributor
- Other developers show consistent but more moderate contribution levels
- Bittensor:
- after Ocean , this has the second highest number of accumulated commits
- The GitHub account dominates with around 14,000 commits
- Other developers show consistent but more moderate contribution levels
- Singularitynet:
- Shows steady growth in development activity since 2017
- GitHub again leads the contributions, but individual developers like Vivek205 and pratik-vii also made significant contributions
- The growth seems to have slowed down somewhat after 2021
- Numerai:
- Keith Goodman was extremely active in 2017-2018 with a sharp spike in contributions
- After 2019, the project saw more distributed development effort among team members
- Overall activity level is lower compared to other projects shown
- Fetchai:
- Has the longest history among these projects, with data going back to 2014
- Shows interesting shifts in developer activity, with different developers taking lead roles at different times
- Ethan Buchman had a notable period of high activity around 2018
- Recent years show more distributed contribution patterns
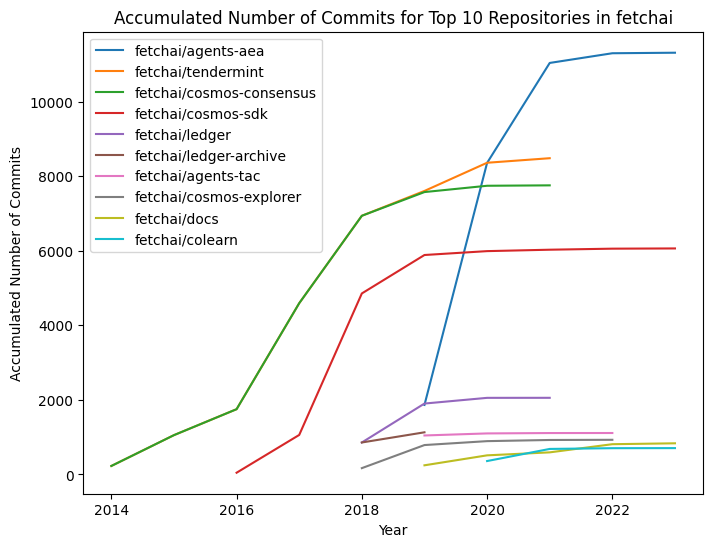
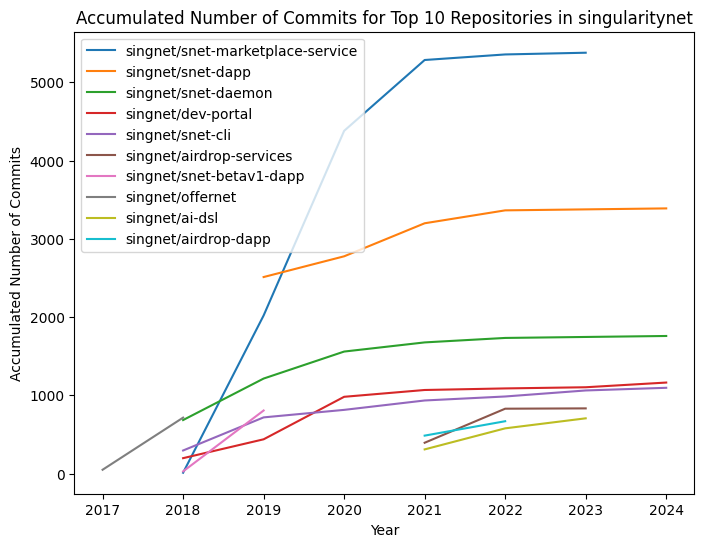
Rank Repositories by Activity
To calculate the most active repositories, we merged the commits and repos datasets of each projects and then using an aggregation method on the number of commits for each repo we extracted the most active repos.
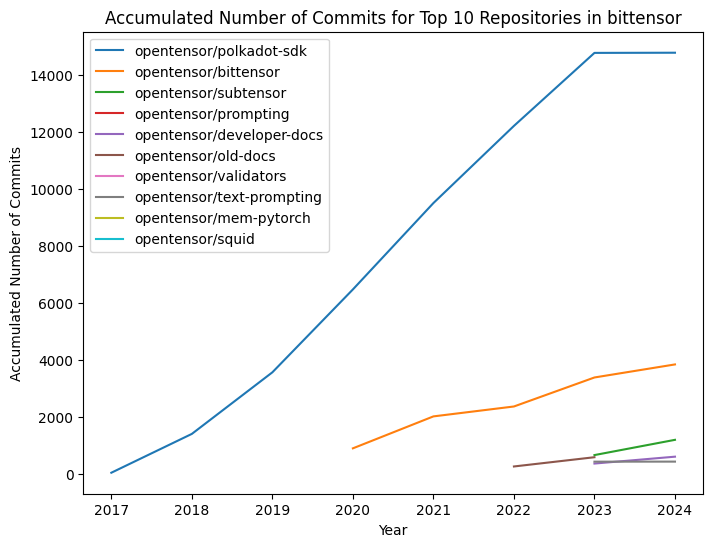
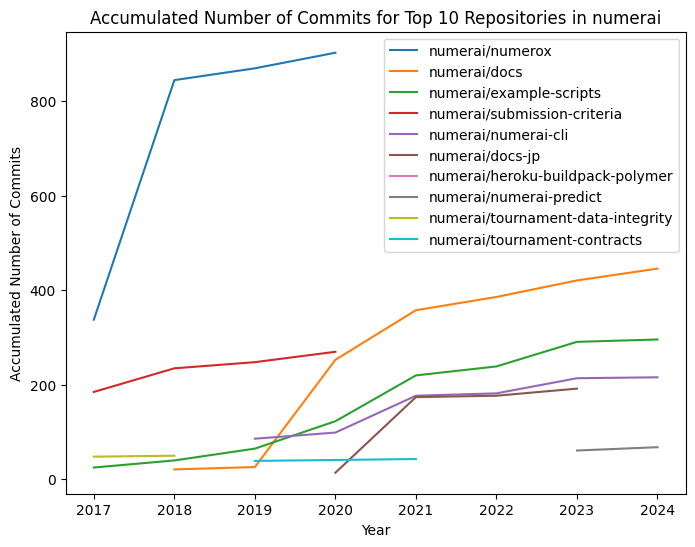
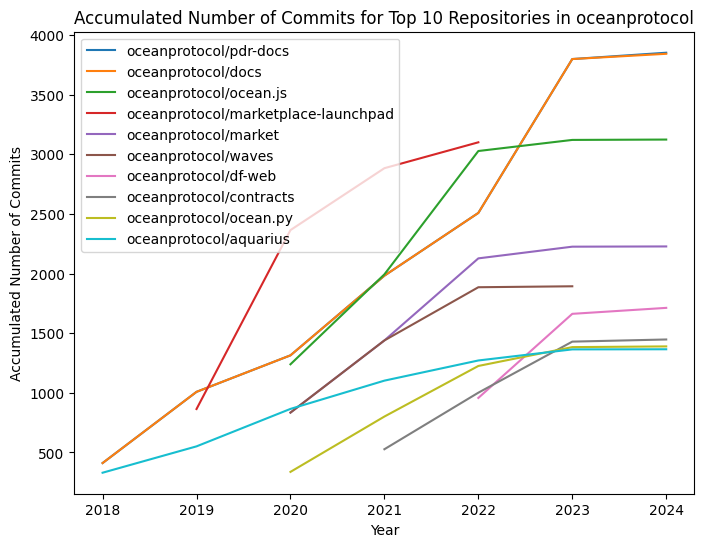
These images show the top ranked repositories by the number of commits for each projects. This will help identify which parts of the project are seeing the most development activity.
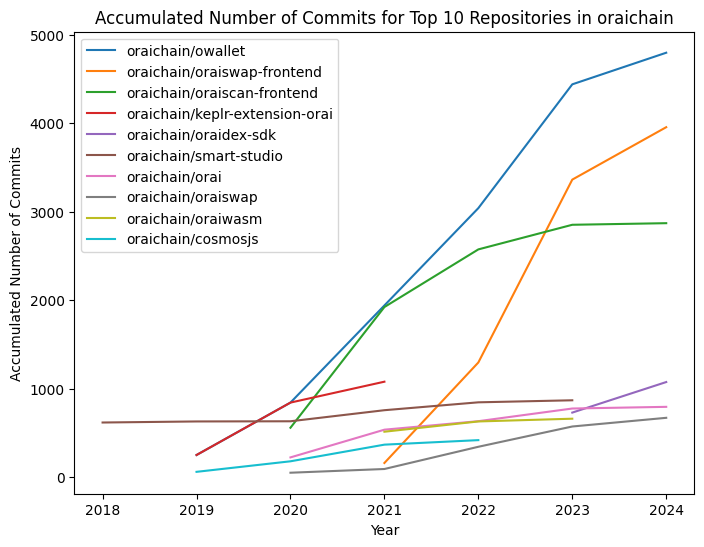
- General View:
- Documentation repositories (‘docs’) appear in the top repos for most projects, showing these teams value keeping their documentation up to date – always a good sign for developer-focused projects!
- Fetchai:
- The ‘agents-aea’ repository is their star player, with over 11,000 commits and a dramatic rise around 2020
- ‘tendermint’ and ‘cosmos-consensus’ are also heavily developed, showing Fetch.ai’s strong focus on blockchain infrastructure
- The high activity in agent-related repos suggests a major focus on AI agent development
- Singularitynet:
- Their marketplace service (‘snet-marketplace-service’) leads with about 5,000 commits
- ‘snet-dapp’ is the second most active, showing strong focus on decentralized application development
- The distribution suggests they’re heavily investing in user-facing services and marketplace functionality
- Bittensor:
- The ‘polkadot-sdk’ repository dominates with over 14,000 commits, showing heavy focus on Polkadot integration
- There’s a big gap between the SDK and other repositories
- Recent focus seems to be on core infrastructure with ‘bittensor’ and ‘subtensor’ repositories
- Numerai:
- ‘numerox’ saw intense development in 2018 with a sharp spike
- Documentation (‘docs’) has seen steady growth over time
- Overall commit numbers are lower compared to other projects
- Ocean Protocol:
- More balanced development across repositories
- Documentation (‘docs’ and ‘pdr-docs’) are among the most active repos
- Strong focus on marketplace and JavaScript tools (‘ocean.js’)
Correlation
In this part we are going to determine the correlation between developer activity and project token price in different timeframes (short-term, medium-term, long-term). This analysis help us to understand if phases of high or low activity impact token price. For each token , below we show its three correlation matrices in long (quarterly), mid(monthly ) and short (weekly) term from left to right respectively
Ocean Protocol
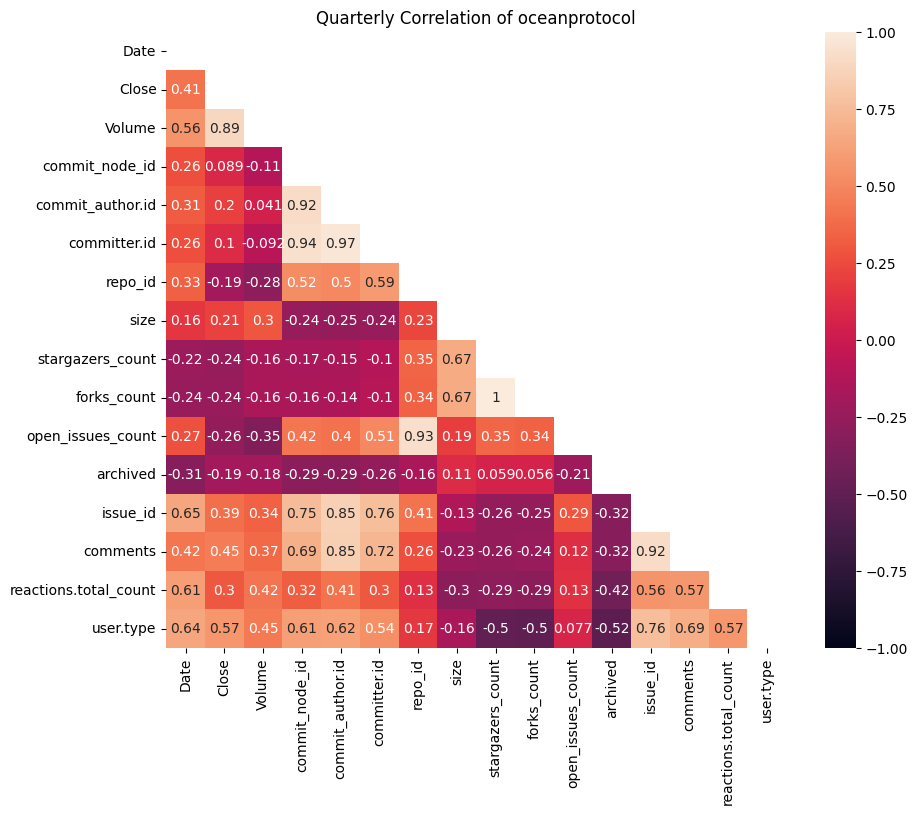
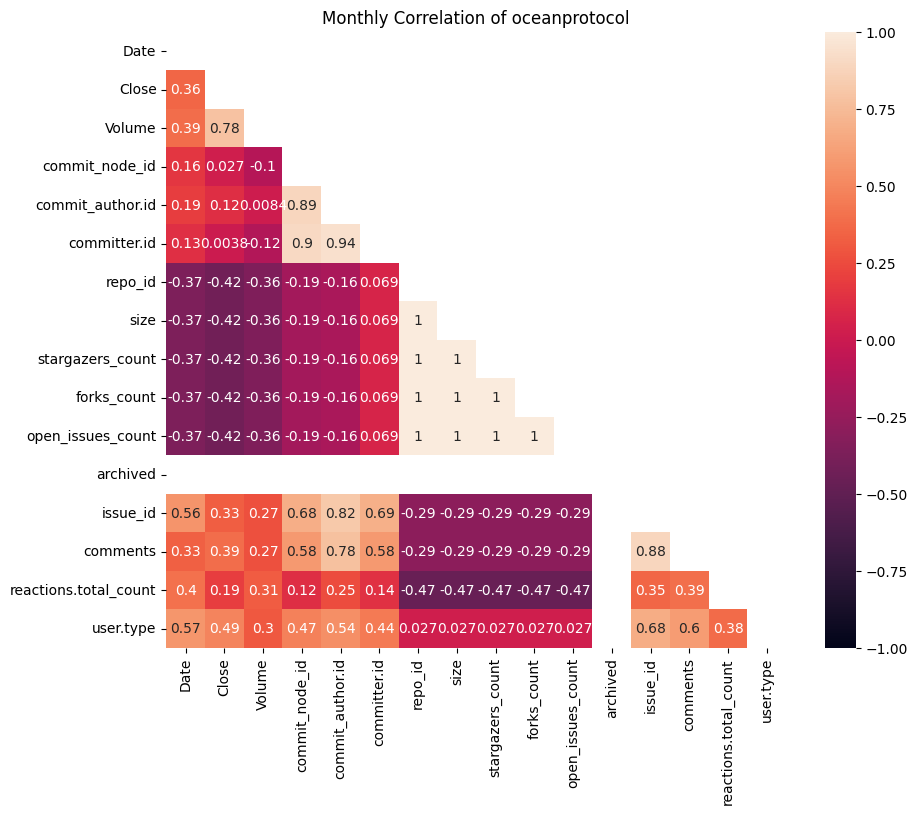
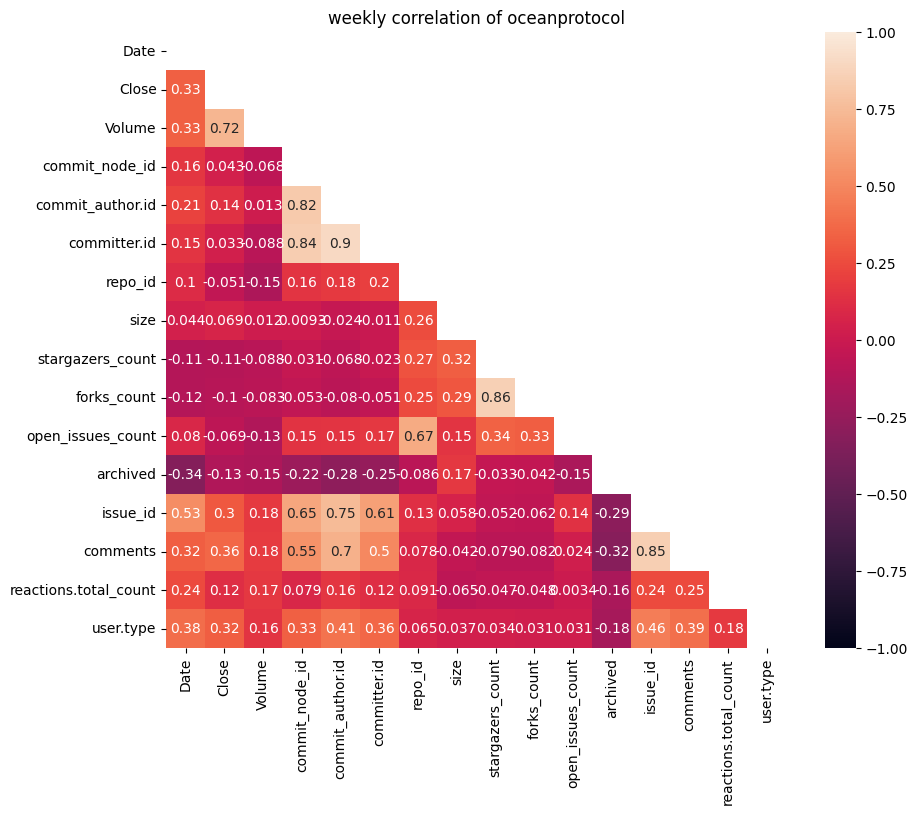
- Weekly and monthly correlations between closing price and GitHub activity (commits, issues, reactions, etc.) are weaker compared to the quarterly view.
- In the quarterly view, price correlation with volume (-0.56) is more negative, showing that higher trading activity might be linked to price drops.
- The relationships between different GitHub metrics (like forks, stars, and commits) fluctuate more in short-term (weekly & monthly).
- The trends stabilize in quarterly long terms, with stronger positive correlations between GitHub repo size, commit count, and forks/stars.
- In the monthly & quarterly heatmaps, stargazers, forks, and repo size show a perfect correlation , meaning they tend to increase together.
- On a weekly basis, these metrics fluctuate more independently.
Singularity Net
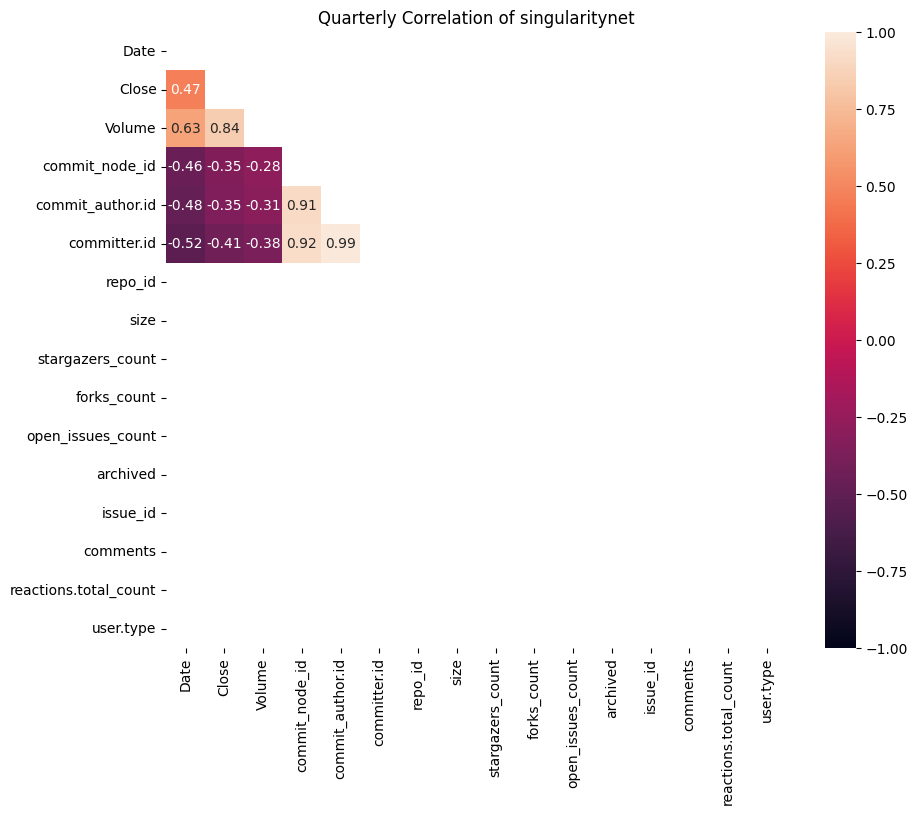
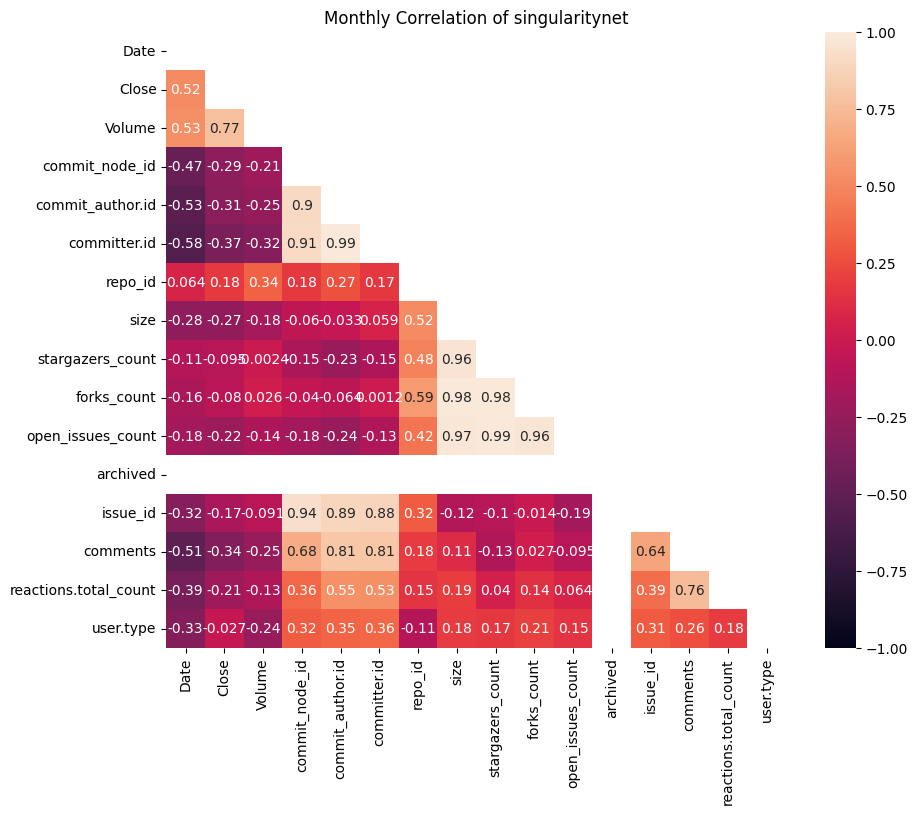
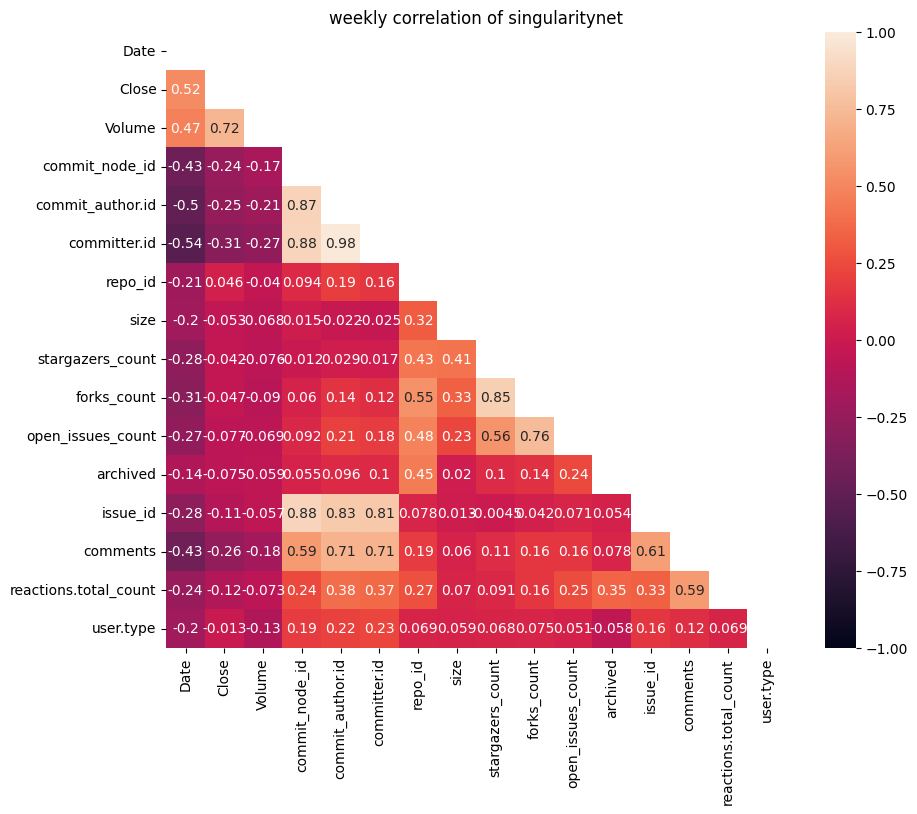
the quarter view has less data and most of data columns appeared to be empty. Looking at monthly and weekly periods :
- There’s a strong positive correlation (0.77-0.84) between volume and price
- Commit-related metrics (commit_node_id, commit_author_id) have slight negative correlations, suggesting that more development activity doesn’t immediately drive price up
- Short-term development activity (commits) actually shows a slight negative relationship with price
- Community engagement metrics (stars, forks) tend to move somewhat in line with price
- The correlations are generally stronger and more stable in the monthly view compared to weekly
FetchAi

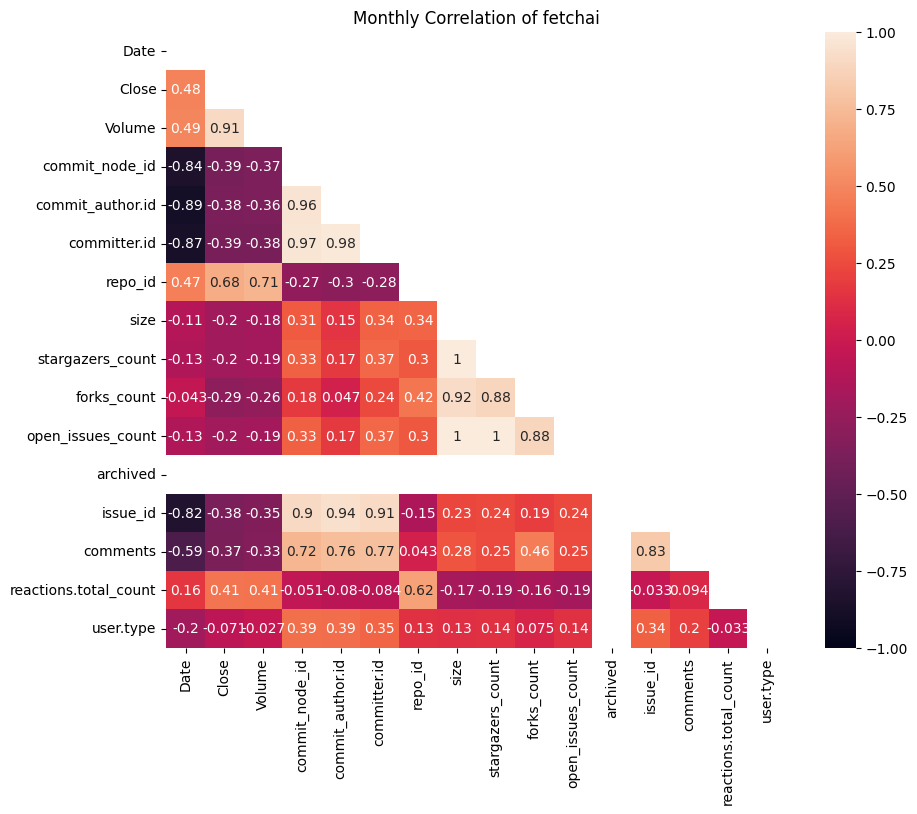
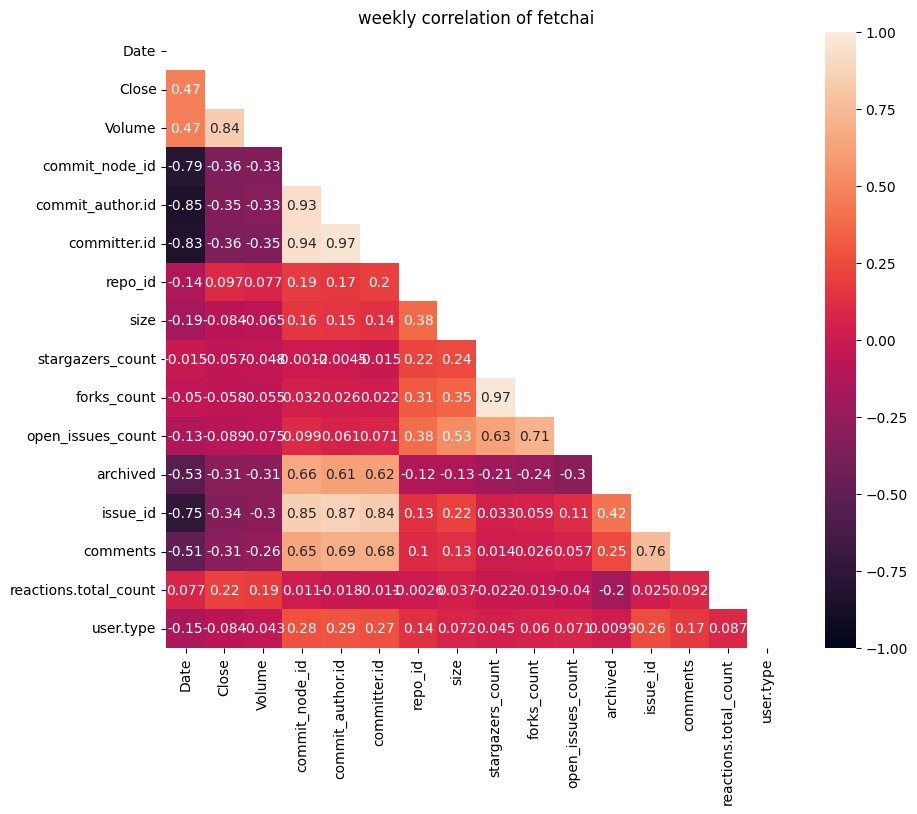
- Interestingly, developers seem to be more active when prices are lower
- Trading volume and price movements become more aligned over longer timeframes
- Community metrics (stars, forks) are highly correlated with each other but show limited correlation with price
- Issue tracking activity increases during price downturns, particularly visible in longer timeframes
- The monthly timeframe shows the most balanced correlations across different metrics, suggesting it might be the most representative period for analyzing the project’s overall health
- Weekly data shows more random relationships
- Monthly and quarterly patterns are clearer and stronger
NumerAi
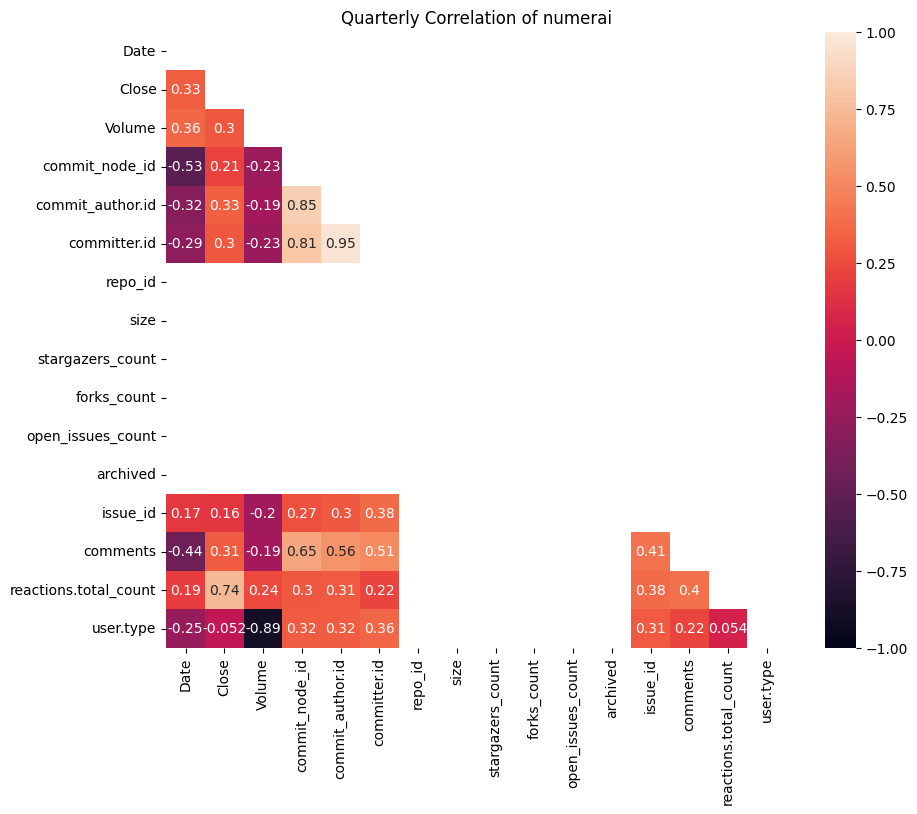
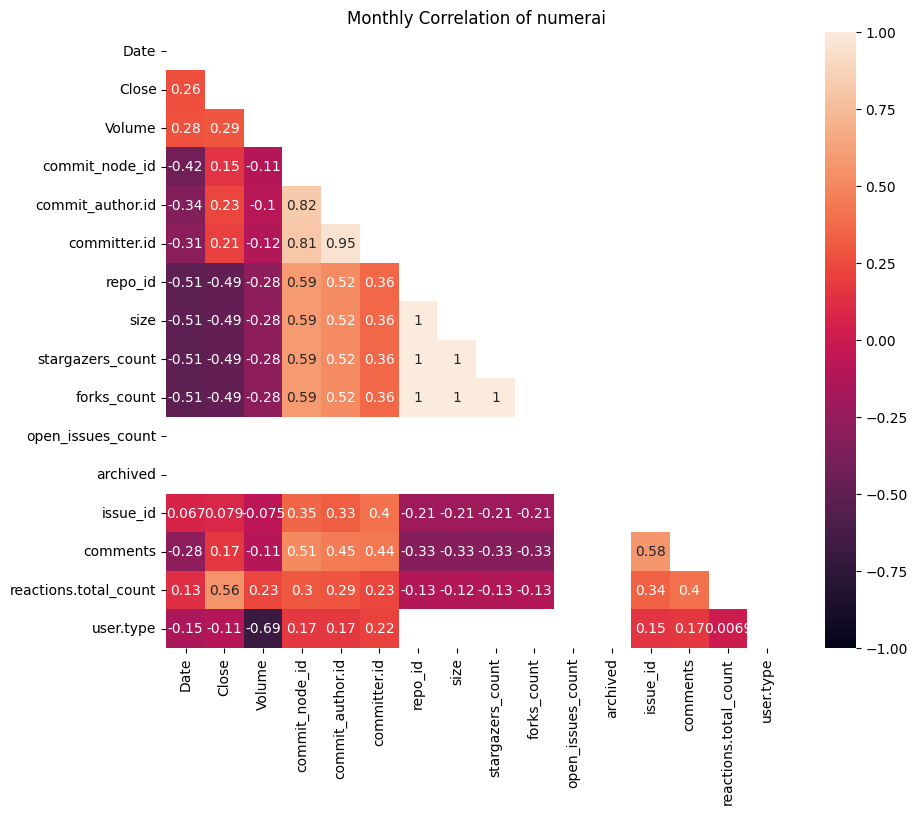
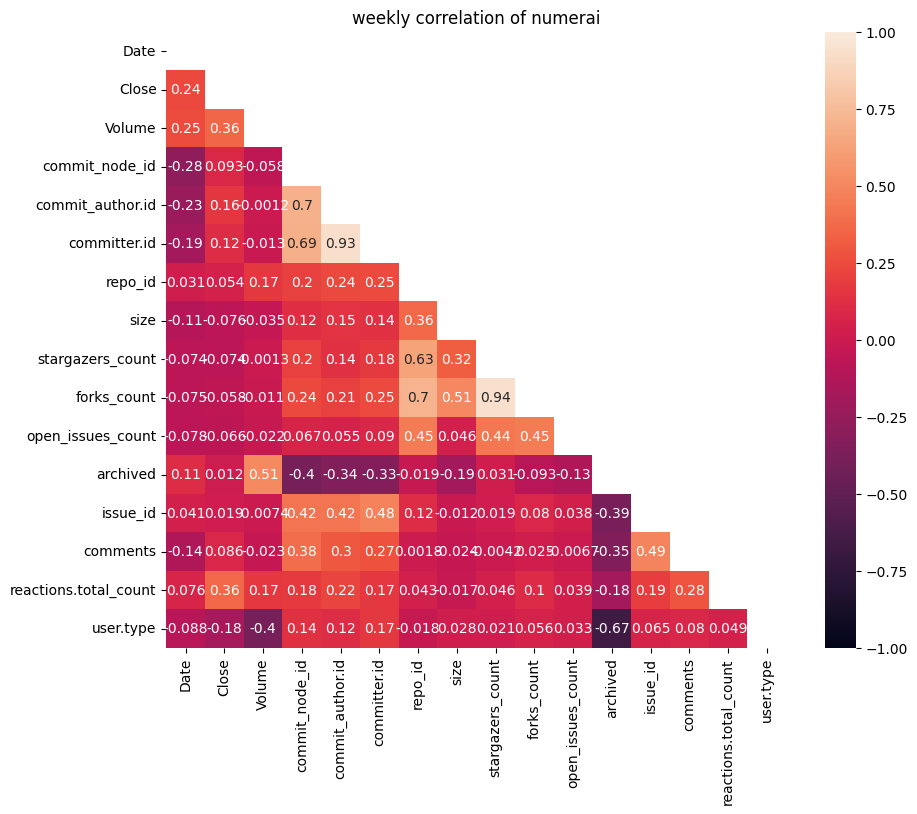
- Volume consistently shows a positive correlation with price (Close) across all timeframes, however relationship gets stronger as we go from weekly (0.35) to quarterly (0.3) data, suggesting price and volume tend to move together
- Commit-related metrics (commit_node_id, commit_author_id, committer_id) generally show moderate negative correlations with price, this negative relationship is strongest in the monthly view, where some commit metrics show correlations around -0.4 to -0.5
- Stargazers, forks, and open issues tend to move together (showing high correlation with each other), but they show weak to moderate negative correlations with price in the monthly and quarterly views
- Comments and reactions show varying correlations across timeframes, in the weekly view, they have weak correlations with price. The relationships become more negative in longer timeframes
Bittensor
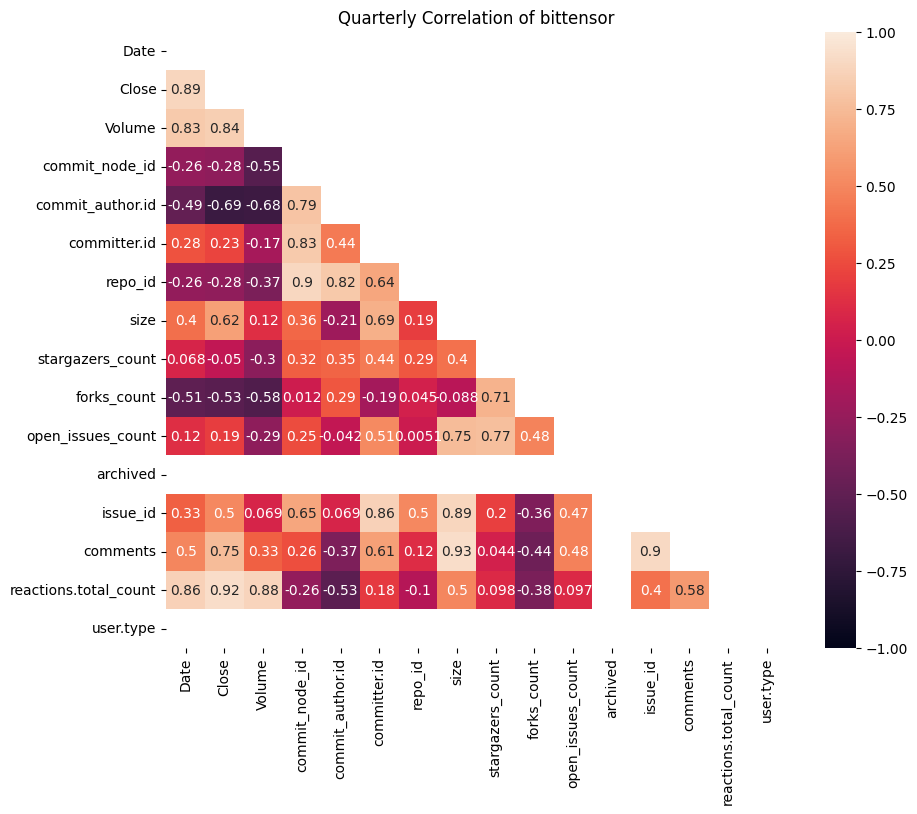
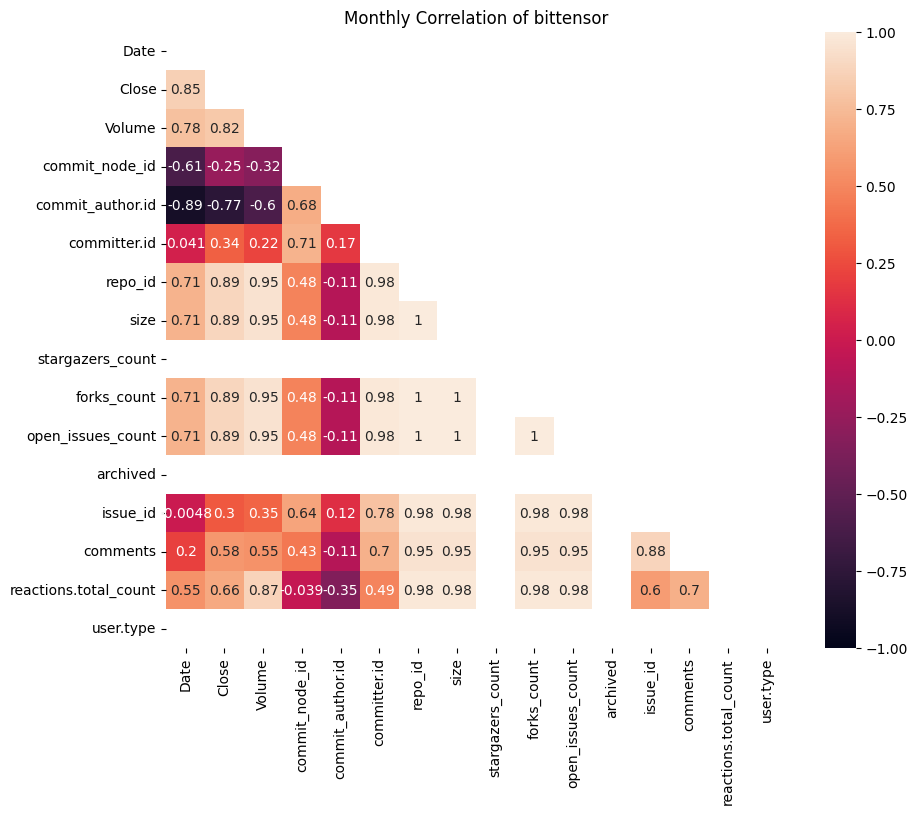
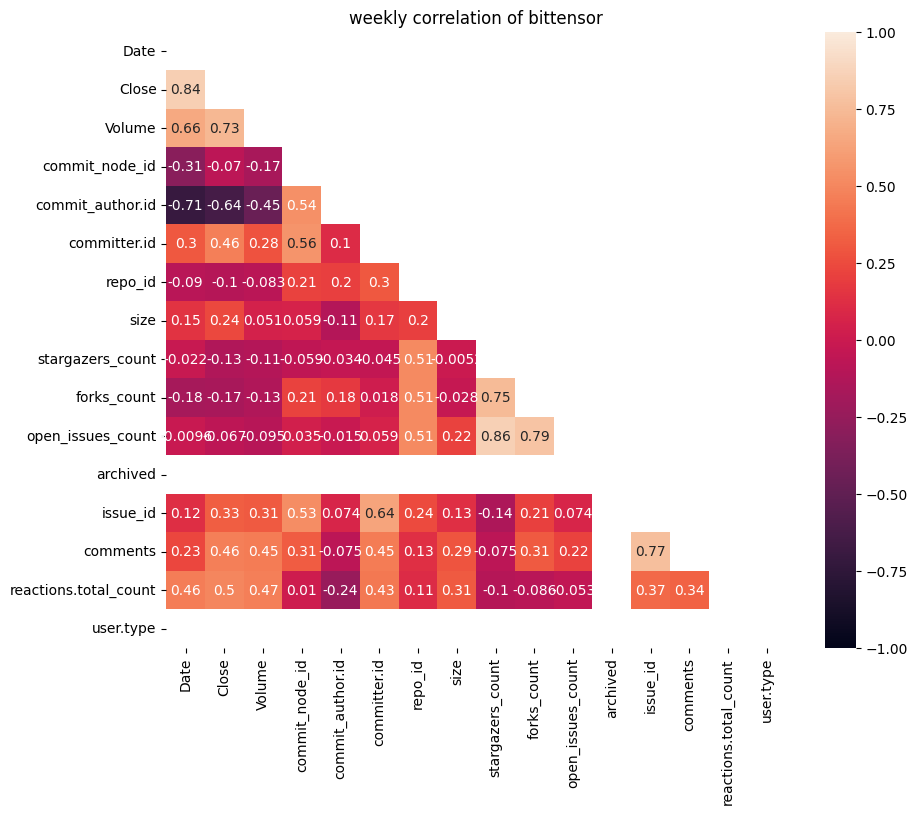
- The same as before, Volume and Close price show consistently strong positive correlations across all timeframes (0.64-0.89)
- Commit-related metrics (commit_node_id, commit_author_id) show moderate to strong correlations with price. These correlations are strongest in the monthly timeframe.
- The “stargazers_count” (GitHub stars) shows an interesting pattern:
- Very weak correlation weekly (near 0)
- Strong positive correlation monthly (close to 1)
- Moderate correlation quarterly
- This might suggest that community interest has a stronger relationship with price in the medium term
- Open issues and forks show stronger correlations in monthly data compared to weekly or quarterly. This could indicate that project development momentum has the most noticeable relationship with price on a monthly basis
Oraichain
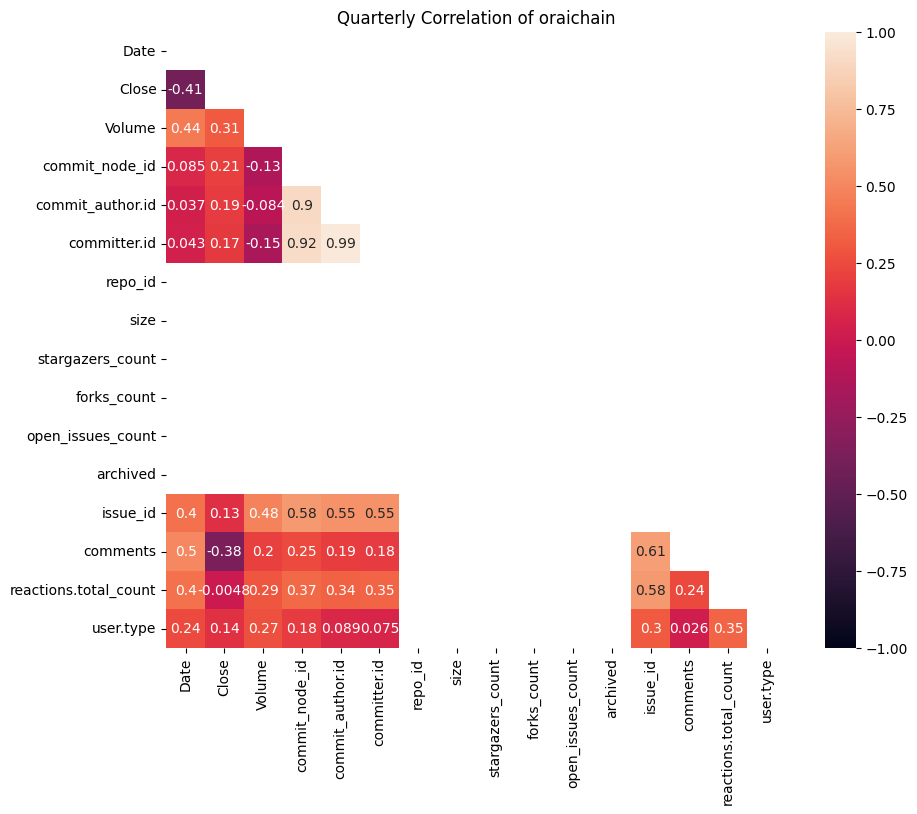
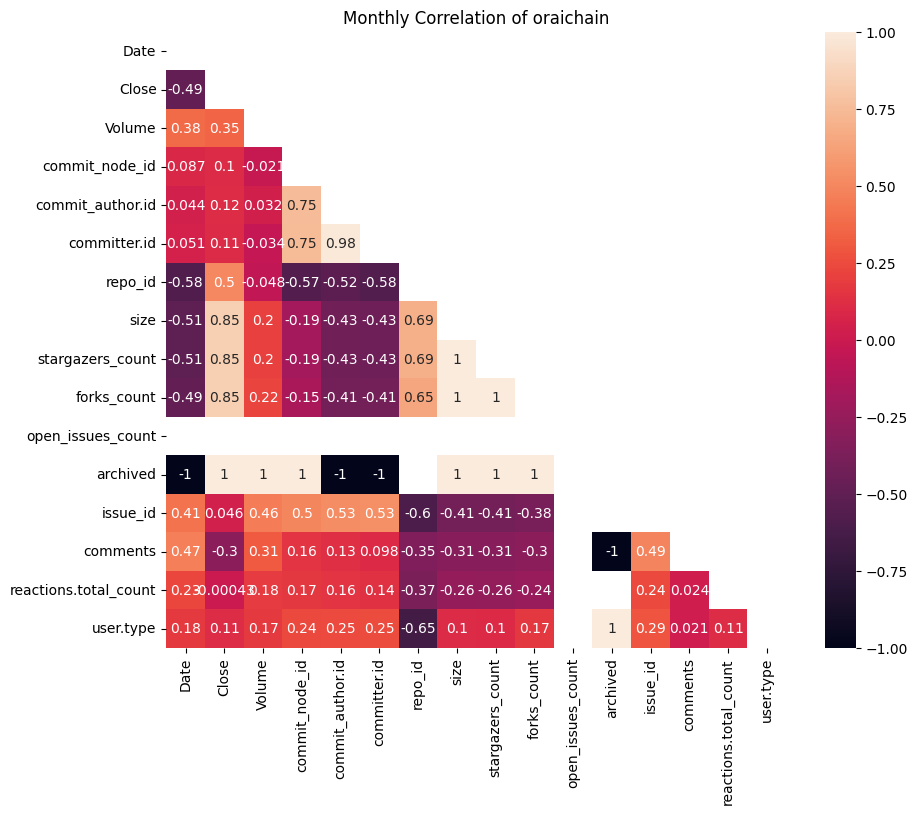
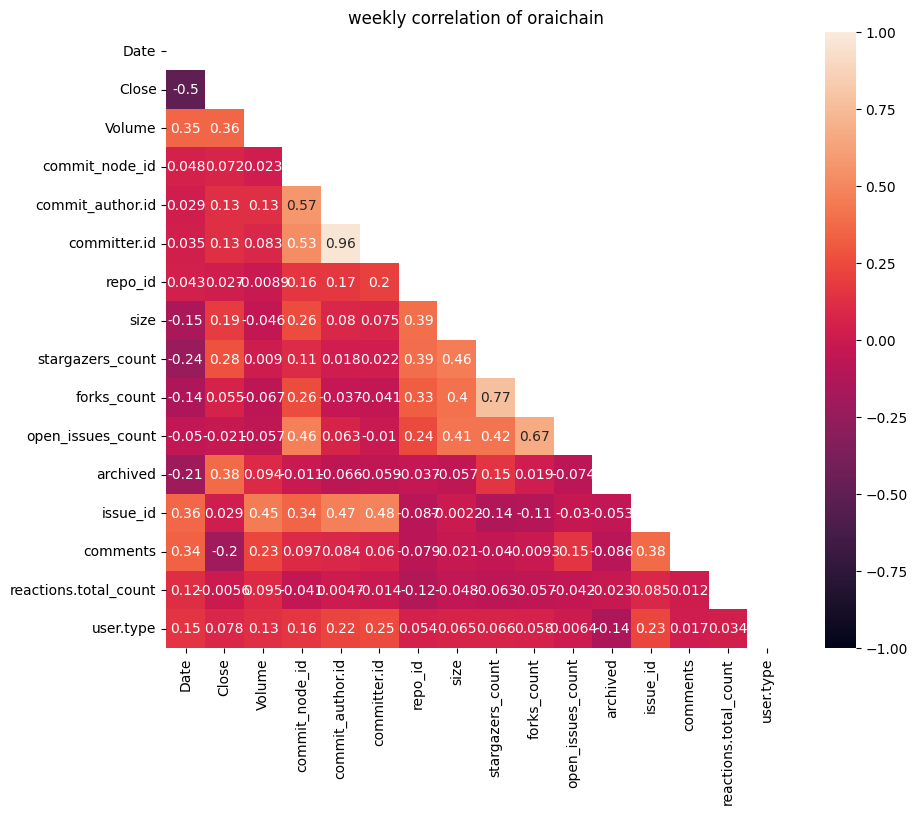
- Short-term (weekly) activity doesn’t seem to have much connection with price
- As we look at longer periods, developer activity becomes more strongly linked to price movements
- Basic community metrics (like reactions and comments) matter less than actual development activity
- Commit-related metrics get stronger in long terms. They have moderate positive correlations (0.4-0.6) in mid terms whereas to shows strong correlation in log terms. (0.6-0.9)
Time Lags
Here we tend to analyze different time lags between developer activity and token price to find the ones that maximize correlation. the following plots display the correlation between different developer activities (such as number of commits, issues, repos, and …) and token price across various time lags (each representing a week) This will help us identify any lagged effects between developer activity and token price movements.
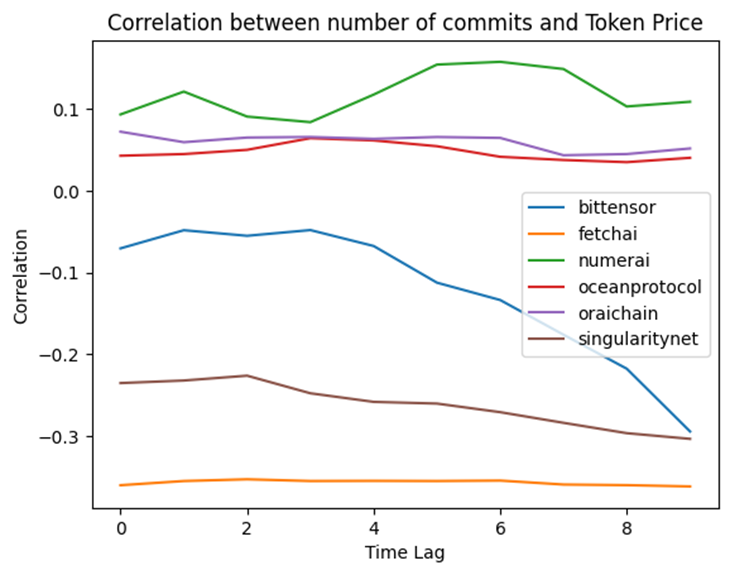
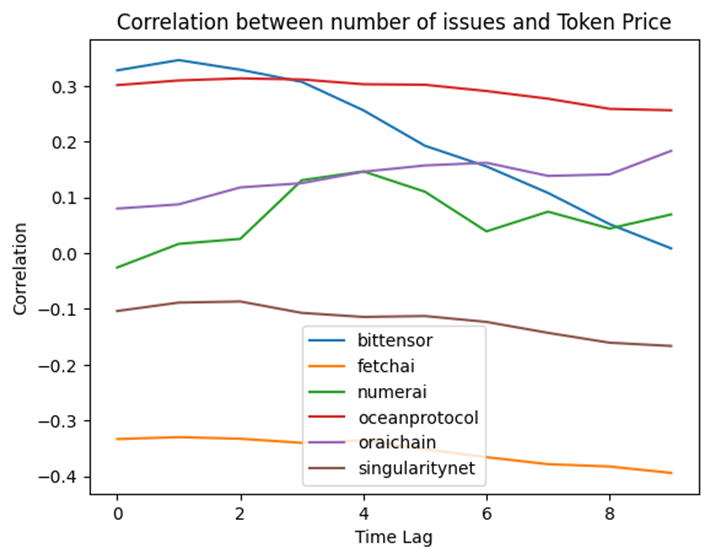
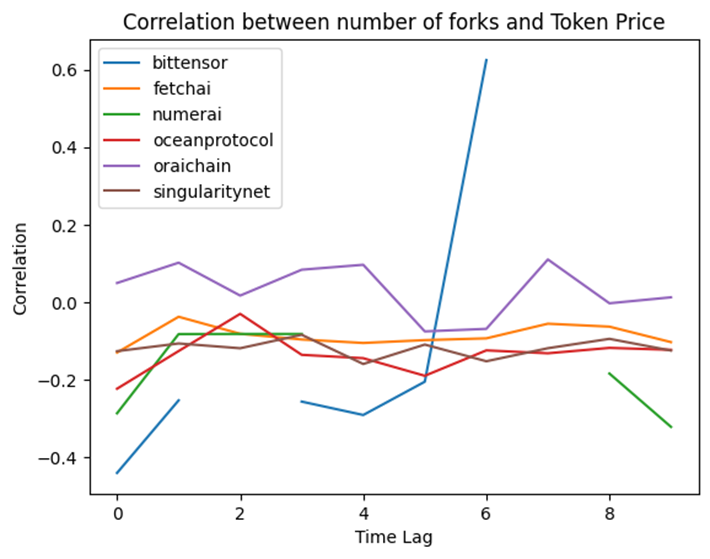
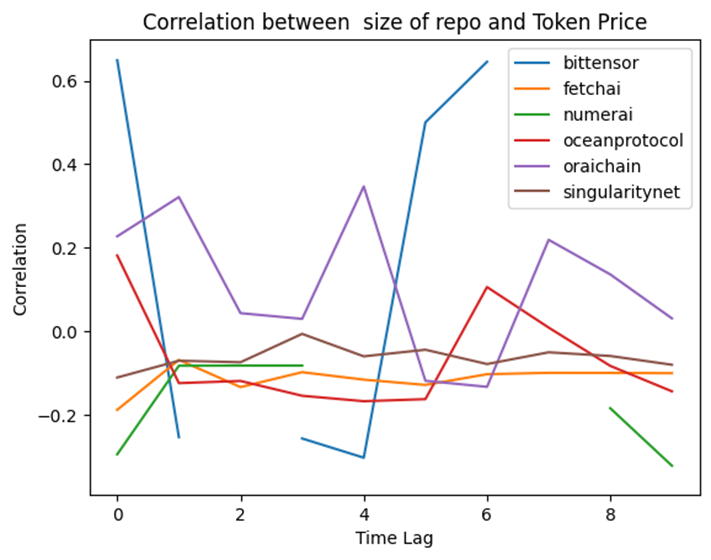
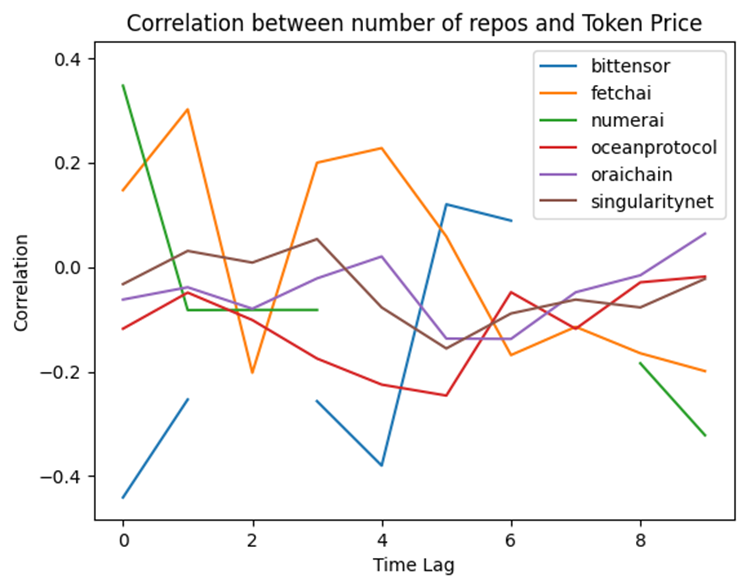
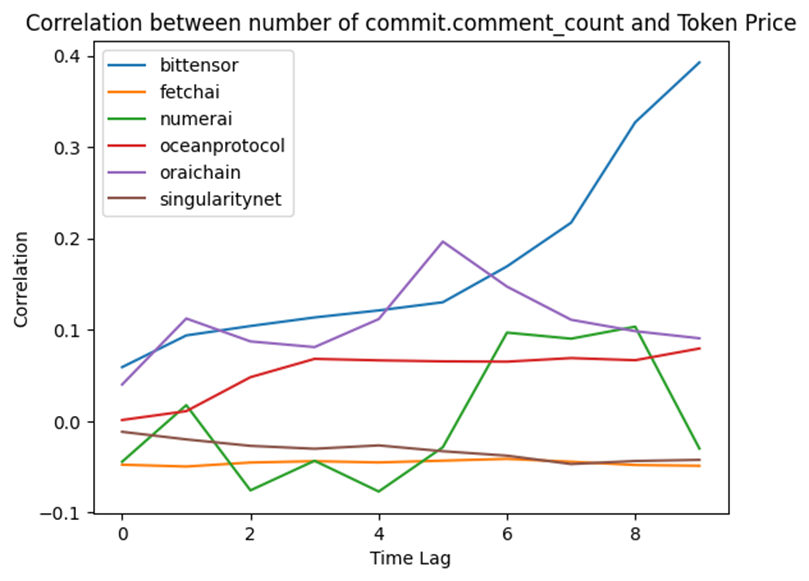
Looking at these images :
- the correlation between Number of commits and also Number of issues with tokens price show relative stead correlation with tokens price for most tokens except of bittensor. For Bittensor, this correlation decreases gradualy over time. theses to metrics despite of the other metrics do not rely on time and remain the same.
- For the other plots , Bittensor consistently shows the highest correlations, especially with number of forks , number of comments per commits and repo size. Interestingly, when it comes to number of comments per commit the correlation has risen significantly over the time.
- Fetchai behavior when analyzing the number of repos is so erratic , though in the other plots its change is very slight and modest.
- In general, Oraichain, Ocean Protocol and Numerai have fluctuations in their correlation with different metrics over the time
Google Trend and token Price
The image displays scatter plots showing the correlation between the prices of six different tokens and Google Trends data. Each plot represents a different token, with price on the y-axis (in USD) and the correlation between price and Google Trends on the x-axis.
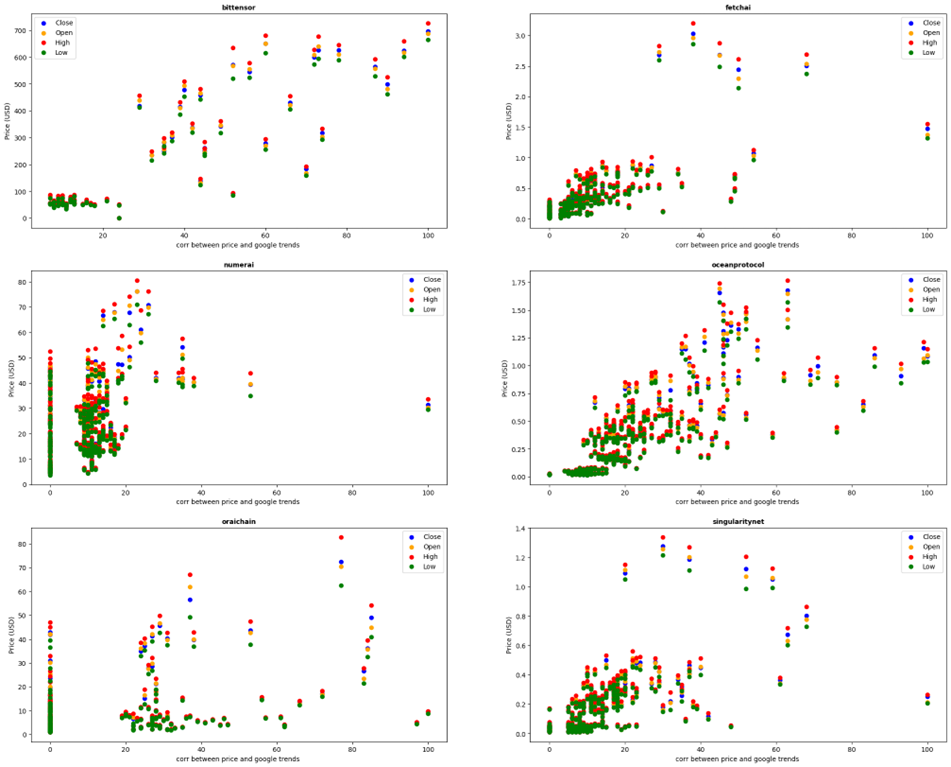
- BitTensor: There is a general positive trend between the correlation with Google Trends and the price.
- Fetch.ai: This token shows a weaker correlation overall. The majority of the data points are clustered around lower correlation values, with prices mostly under $1.
- Numerai: There is a wide range of prices, but a large number of data points are clustered at lower correlation values. Prices mostly concentrated between $10 and $30, with some outliers reaching higher prices.
- Ocean Protocol: There is a positive trend between the correlation and the price. Prices are mostly between $0.25 and $1.25, with higher correlations aligning with higher prices.
- Oraichain: The correlation values are mostly low, with prices concentrated below $30. There are few outliers with higher prices, but the overall correlation does not show a strong trend.
- SingularityNet: Shows a positive trend between correlation values and price. Prices are mostly below $1, with higher prices seen at higher correlation values.
In general , Tokens like BitTensor, Ocean Protocol, and SingularityNET show a stronger positive correlation between their prices and Google Trends data. Fetch.ai, Numerai, and Oraichain have weaker or less clear correlations.
Final Note and Conclusion
In this article, we tried to analyze the impact of GitHub developer activity on the prices of crypto tokens. We examined various metrics such as commit frequency, issue tracking, and repository activity to determine any significant correlations. The findings suggest that there is a notable relationship between developer engagement and token price movements.
One improvement for future studies could be incorporating more diverse data sources and considering external market factors that might influence token prices. Additionally, further research could explore the long-term effects of sustained developer activity on the stability and growth of crypto assets.


This Post Has One Comment
Your work carries a sense of timelessness, as though these insights could belong equally to the past or the future. It offers wisdom not tied to moment or trend, but to the enduring nature of human experience.