
Crypto factor modeling is an approach used to analyze and predict the return of cryptocurrencies by identifying and assessing various factors that influence their returns. These factors can include market trends, liquidity, volatility, momentum, and other economic indicators. By modeling these factors, investors and analysts can gain insights into the potential risks and opportunities within the crypto market, helping to inform investment strategies and portfolio management decisions.
In this work , using market factors ,economic factors and environment factors we deeply study and investigate the behavior and impact of these factors on nearly 120 cryptos over time.
Sit down tight and stay with us…

the outline of this work is as follow:
Data Collection
Unfortunately most of the accurate sources of crypto historical data need premium subscription or are restricted in some specific countries. So, finding a comprehensive and accurate data was really challenging. However , Thanks to some free and accurate sources like CCXT library (to collect limited historical data), Fred (to collect some economic data), google trends API and Coingecko API, we could gather sufficient amount of historical data for nearly 120 cryptos which are suggested in Numerai website by considering the following circumstances:
- Stablecoins, wrapped tokens, liquid staking tokens (e.g. stETH, rpETH)
- Tokens less than two years old
- Tokens with less than $1,000,000 trading volume in the last 24 hours
- Lower market cap tokens for duplicate symbols
- After the above are removed, tokens that are either too stable or highly correlated:
- Stable: Average 6 month daily returns less than 0.00001
- Correlated: Removal of tokens with a correlation in daily returns >= 0.95 over the past 6 months, keeping the one with the highest market cap
OHLCV data : this data collected from CCXT library for 128 tokens. However CCXT has also limitation rate for accessing the full historical data and it allows users download around 1000 records per tokens without API key (data were fetched from Binance Exchange). you can see the complete list in here
Circulating supply : In order to calculate market cap for each crypto, we collected their corresponding circulating supply from coingecko API.
Google trend : to collect the google trend data for each 128 tokens, we used pytrend library in python and fetched 5 years data of each tokens.
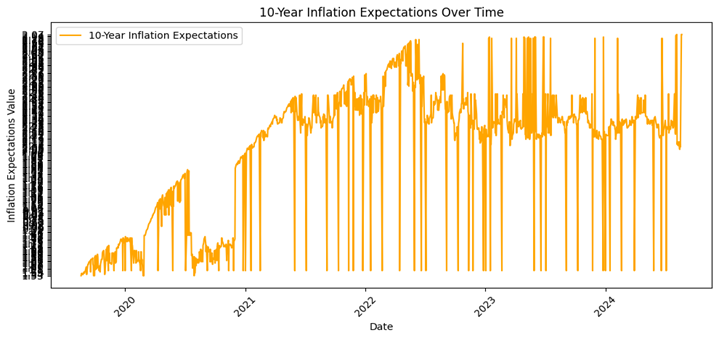
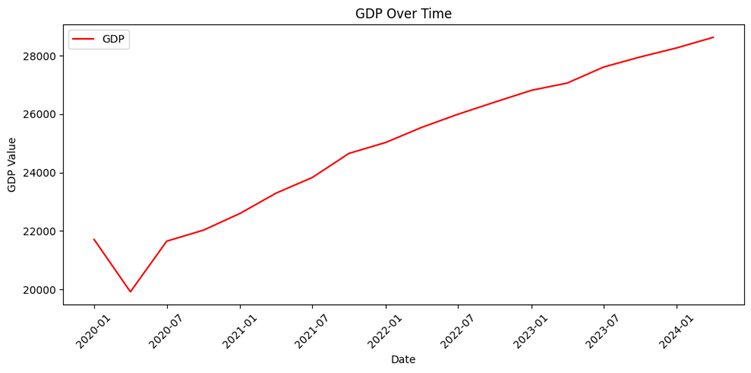
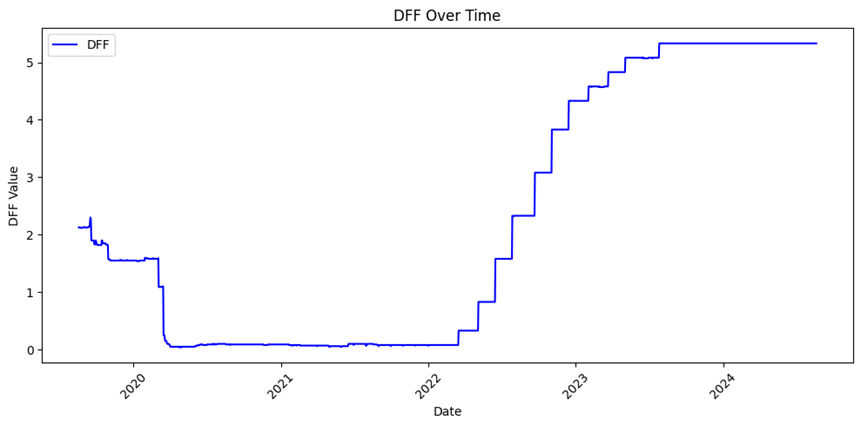
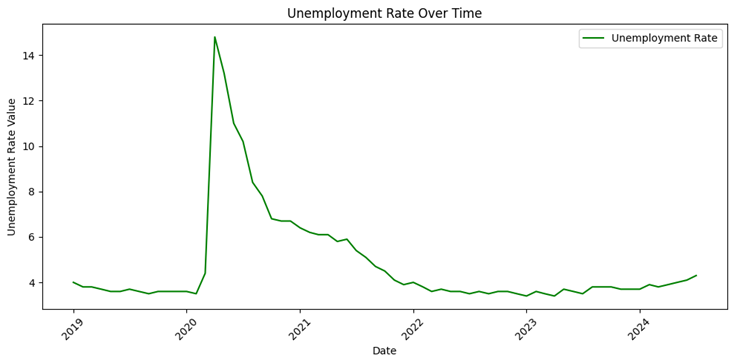
FRED : this website holds all economic data of US and worldwide. We downloaded 10-years inflation rate , unemployment rate , Gross domestic product (GDP) and Interest Rate from it.
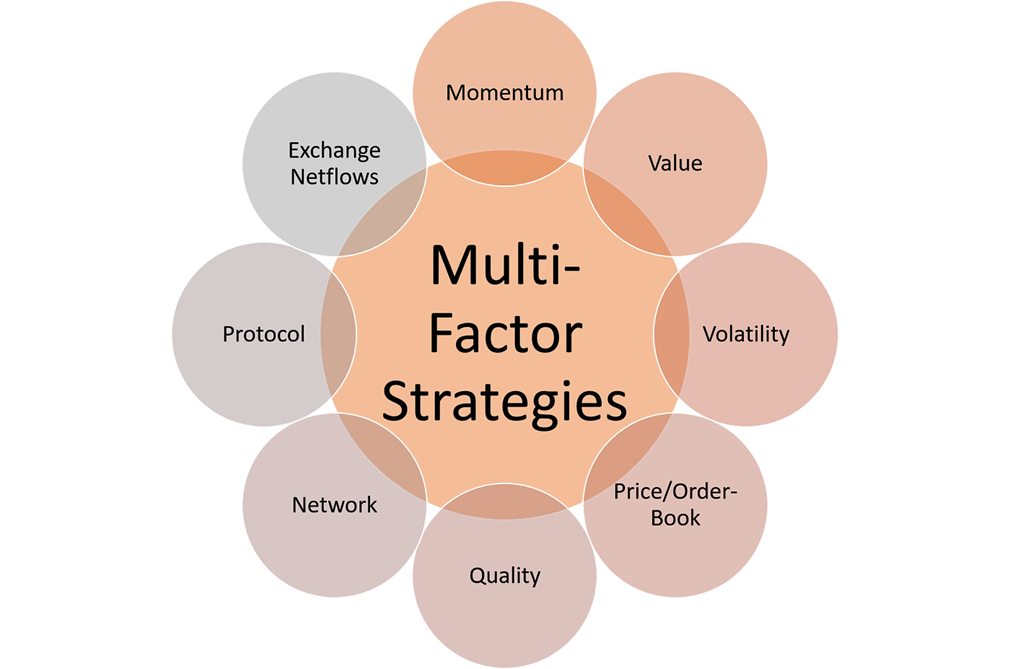
We used 3 kind of factors for our analysis :
- Market Factors : Momentum , market cap , size factor, liquidity , volatility , value factor and amihud_illiquidity
- Economic Factors : Federal Funds Effective Rate (DFF) , inflation rate. GDP
- Social Media : Google Trends
Factor Construction
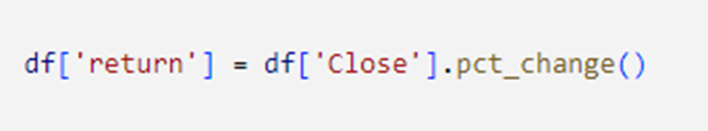
Return is calculated as the percentage change in the closing price from one period to the next. This measures the asset’s performance over time, indicating gains or losses.
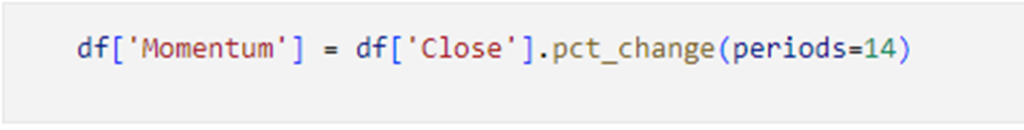
Momentum measures the tendency of an asset’s price to continue moving in its current direction. it is calculated as the percentage change in the closing price over a 14-day period. This measures the speed and magnitude of recent price changes, indicating whether the asset’s price is increasing or decreasing.
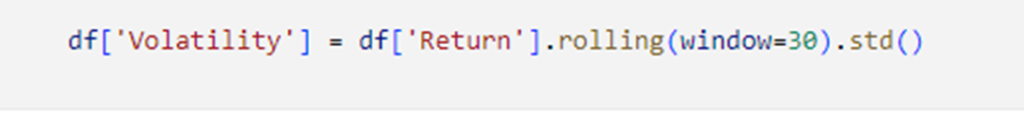
Volatility is measured as the standard deviation of returns over a 30-day window. This captures the degree of variation in returns, reflecting the asset’s risk.
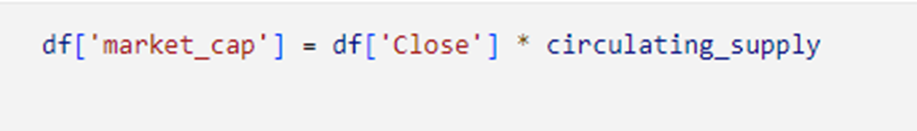
Market Cap Market capitalization is the total value of a cryptocurrency’s circulating supply. It is calculated by multiplying the current price by the circulating supply. This metric provides an estimate of the cryptocurrency’s market value and size.
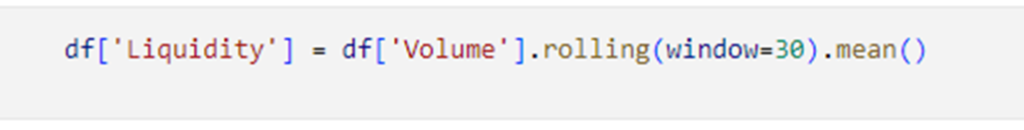
Liquidity is calculated as the average trading volume over a 30-day period. Higher average volume suggests better liquidity, indicating ease of buying or selling the asset without significant price impact.
Amihud Illiquidity This measure captures the price impact per unit of trading volume. It is the average of the absolute return divided by volume over 30 days. Higher values indicate less liquidity, as small trades cause larger price changes.

The size factor often refers to the market cap of a company or asset, used to categorize it into small, mid, or large-cap. In crypto, it can be used to differentiate between larger, more established coins and smaller, emerging ones. The size factor can influence the risk and return profile of the asset, with smaller caps generally being more volatile.

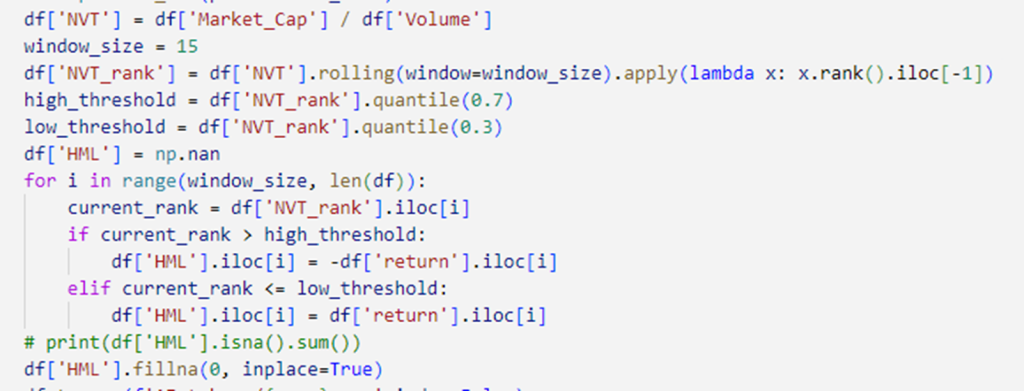
The HML (High Minus Low) factor is constructed by first calculating the NVT (Network Value to Transactions) ratio, which is the market cap divided by volume. This ratio is ranked over a rolling window to assess relative value. High and low thresholds are set using quantiles to identify overvalued and undervalued assets. The HML factor assigns negative returns to overvalued assets (above the high threshold) and positive returns to undervalued assets (below the low threshold). Any missing values are filled with zero to ensure completeness. This process captures the value premium by differentiating between high and low NVT-ranked assets.
EDA and Analysis
Correlations
We examined the correlation of each factors with return for each crypto-currency. We categorized the correlation into three categories : low, moderate and high. based on the results as you can see below, HML is highly correlated with return for some tokens.
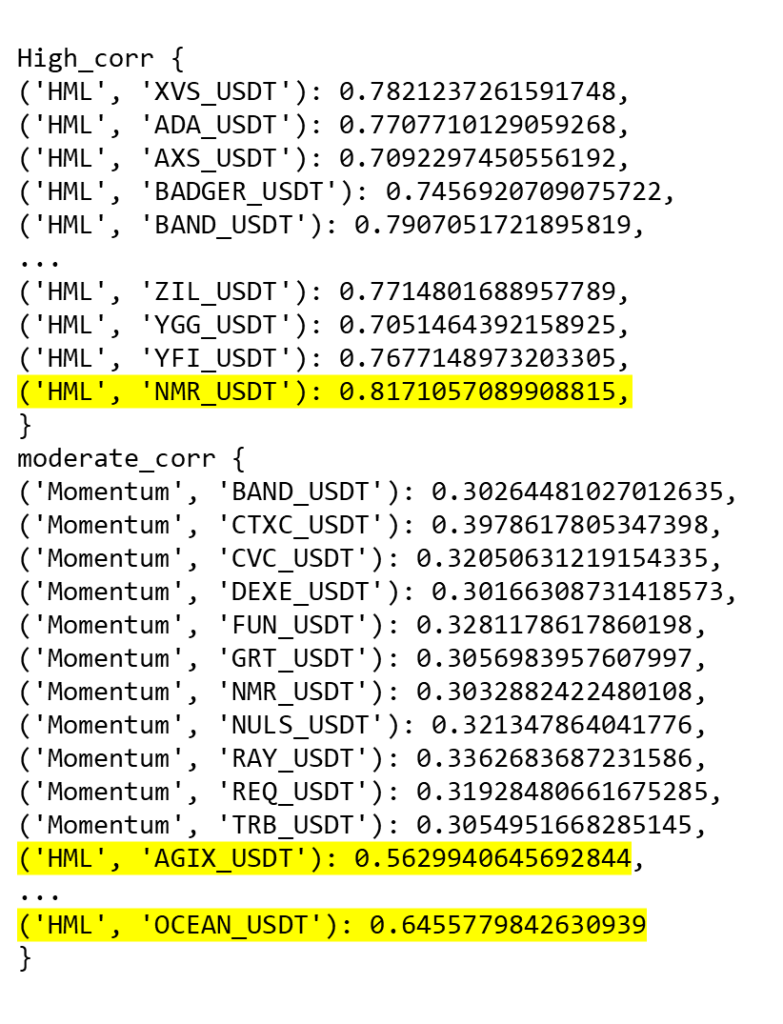
Among other factors, Momentum , Volume, HML and google trends are moderately correlated with return in some tokens. Volume for most tokens were observed to have moderate correlation with return (about 0.3) Other factors have low correlation (less than 0.3) with return.

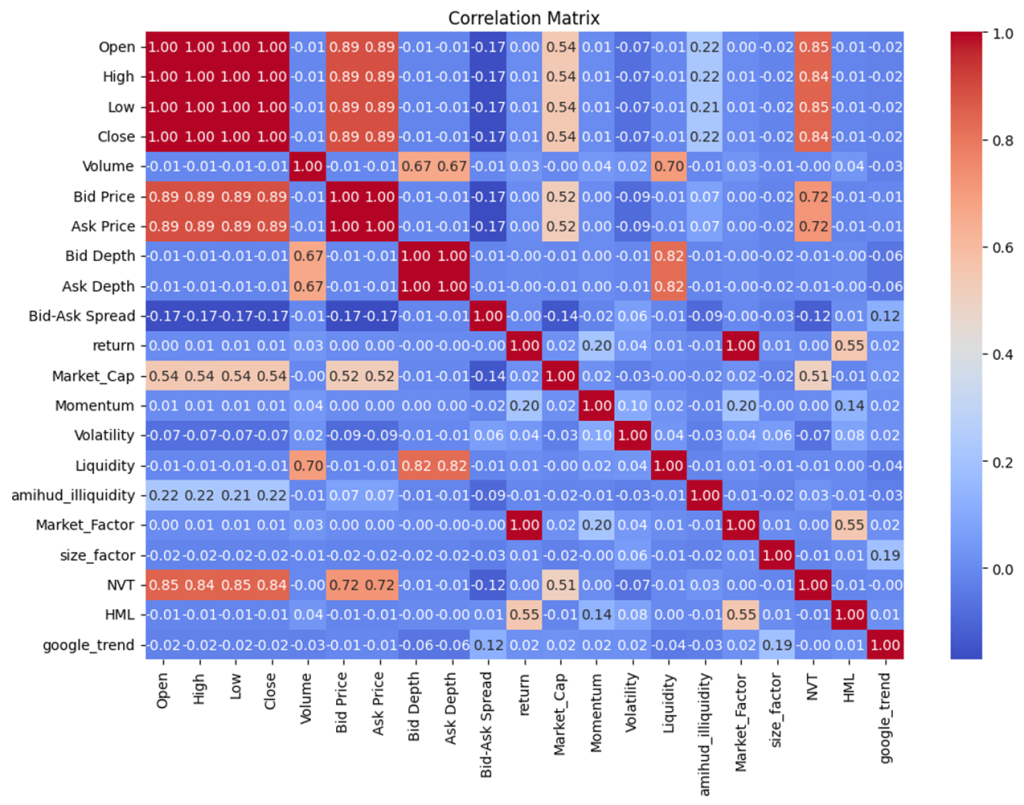
This image is a correlation matrix between all previous mentioned constructed market factors. we can categorize the correlation between factors into three following categories :
- .Strong Correlations:
- Open, High, Low, Close, Bid Price, Ask Price: These have perfect or near-perfect correlations with each other, indicating they move together closely, which is typical for price data.
- Bid Depth and Ask Depth: Also highly correlated, suggesting a relationship in market depth dynamics.
- Moderate Correlations:
- Volume and Liquidity: A moderate correlation exists, indicating that higher trading volumes might be associated with better liquidity.
- Market Cap and NVT: Shows moderate correlation, suggesting that larger market cap cryptocurrencies might have more consistent network value to transaction ratios.
- Momentum and Return: A moderate correlation, indicating that momentum could be a significant factor affecting returns.
- Factors of Interest:
- HML and Return: A moderate correlation suggests that high minus low (HML) factor could be relevant for explaining returns.
- Google Trend: Shows weak correlations with most factors, indicating it might not be a strong predictor of any particular aspect of the market dynamics.
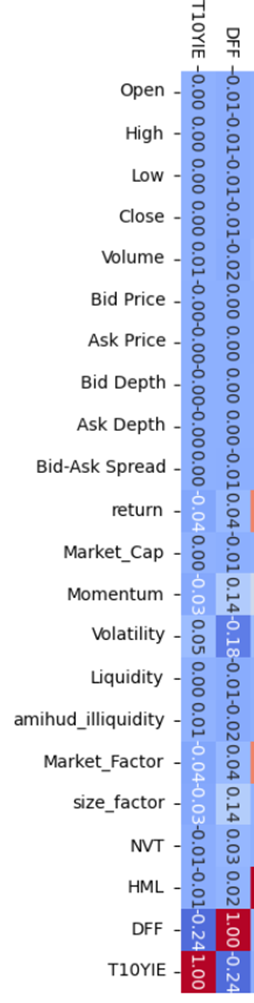
The following figure also shows Pearson Correlation between economic factors (Inflation Rate , Federal Fund Rate) and pre-constructed market factors. Based on the figure :
- DFF (Federal Fund Effective Rate):
- Return: Shows a weak negative correlation, suggesting that changes in the federal funds rate might have a slight inverse impact on returns.
- Volatility: Has a weak negative correlation, indicating that higher DFF might slightly decrease volatility.
- HML: Displays a weak positive correlation.
- T10YIE (10-Year Inflation Expectation):
- Market Cap: Shows a weak positive correlation, suggesting that inflation expectations might slightly influence market cap.
- Return: Displays a weak negative correlation, indicating that higher inflation expectations might slightly decrease returns.
- Volatility: Exhibits a weak positive correlation.
- DFF and T10YIE have minor correlations with most variables, suggesting they might not be strong standalone predictors but could still provide insights when combined with other factors.
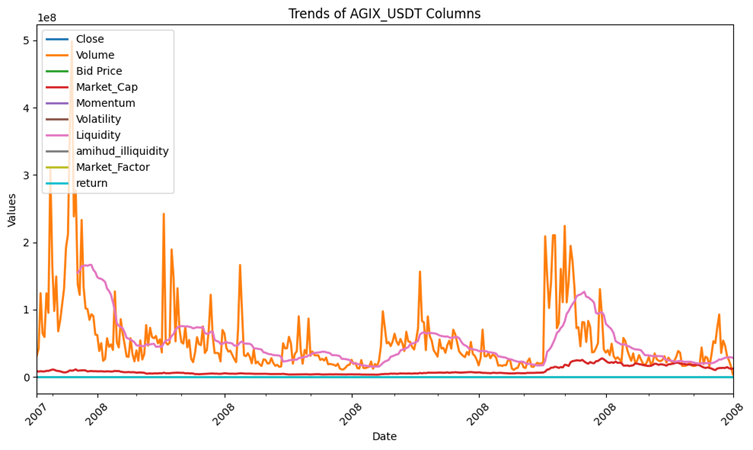
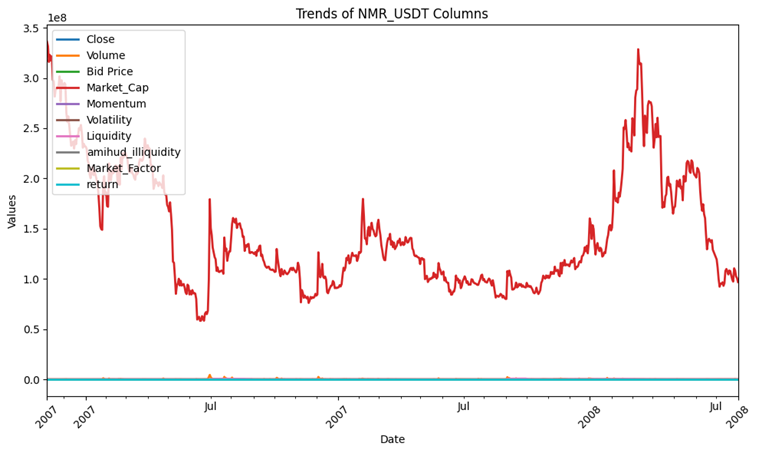
Trends
In this part we ‘re going to compare the most important market factors of all fetched tokens together. Note that because of limitation in accessing the full historical data we only were able to fetch the data since 2021 and therefore the following plots are since this date.
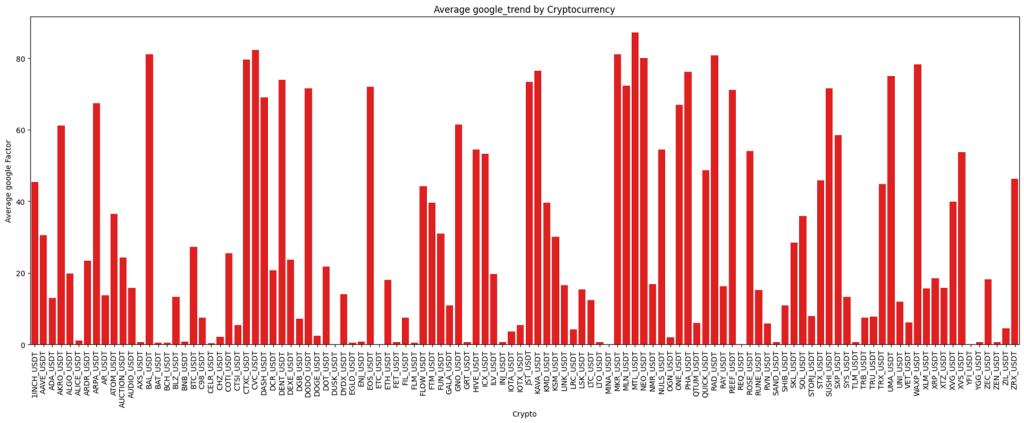
This image shows the average google trend per token. Each token has a corresponding bar indicating its average Google trend score. Based on the image, here are the top five tokens with the highest average Google trend from 2021 till now :
- MTL_USDT
- BAL_USDT
- CVC_USDT
- PAD_USDT
- CTXC_USDT
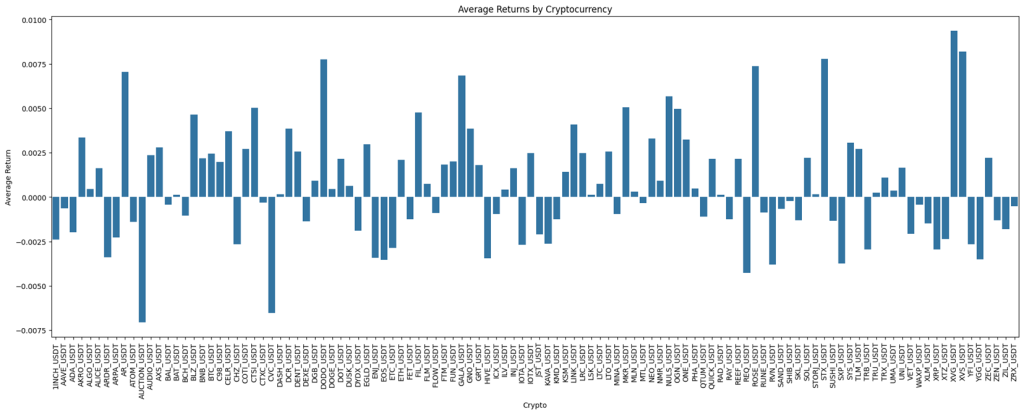
This image shows the average return per token. Based on the image, here are the top 5 tokens with the highest average return scores from 2021 till now :
- GALA_USDT
- XVG_USDT
- XVS_USDT
- FIL_USDT
- DOGE_USDT
and here are the top 5 tokens with the least average return scores from 2021 till now :
- AUCTION_USDT
- CVC_USDT
- EOS_USDT
- REQ_USDT
- RVN_USDT
The variation in returns among the tokens indicates differing levels of volatility and market performance. Investors might consider this when making decisions, balancing between high-return, high-risk tokens and more stable options.
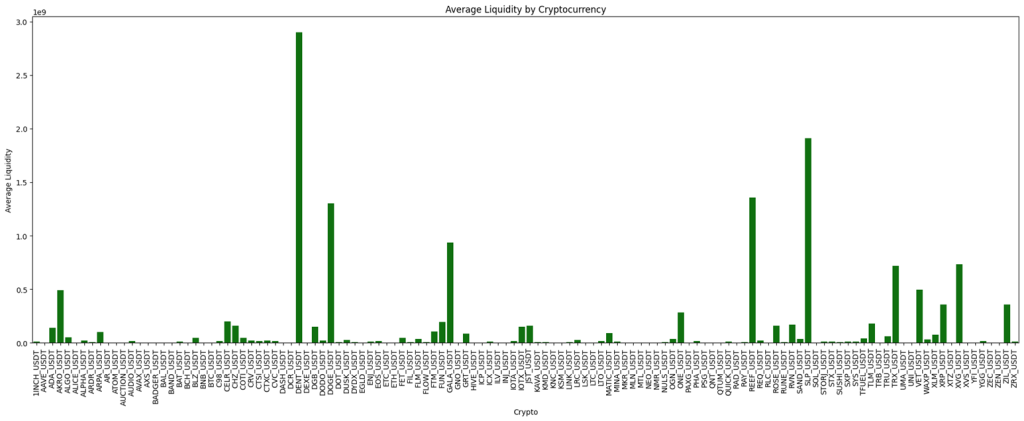
This image shows the average Liquidity per token. Based on the image, here are the top 5 tokens with the highest average Liquidity scores from 2021 till now :
- DENT_USDT ,
- SLP_USDT ,
- REEF_USDT,
- DOGE_USDT ,
- GALA_USDT
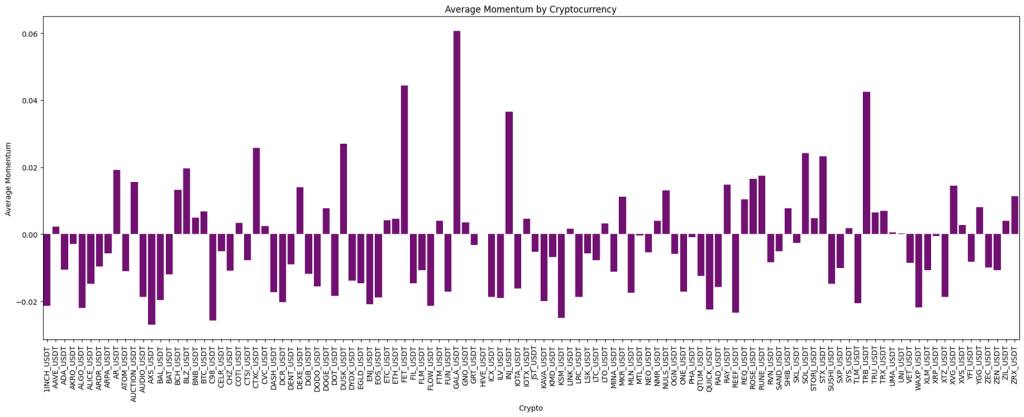
This image shows the average Momentum per token. Based on the image, here are the top 8 tokens with the highest and the lowest average Momentum scores from 2021 till now :
- GALA_USDT (high)
- AUCTION_USDT (high)
- FLOW_USDT (high)
- MINA_USDT (high)
- AXS_USDT (low)
- C98_USDT (low)
- KSM_USDT (low)
- REEF_USDT (low)
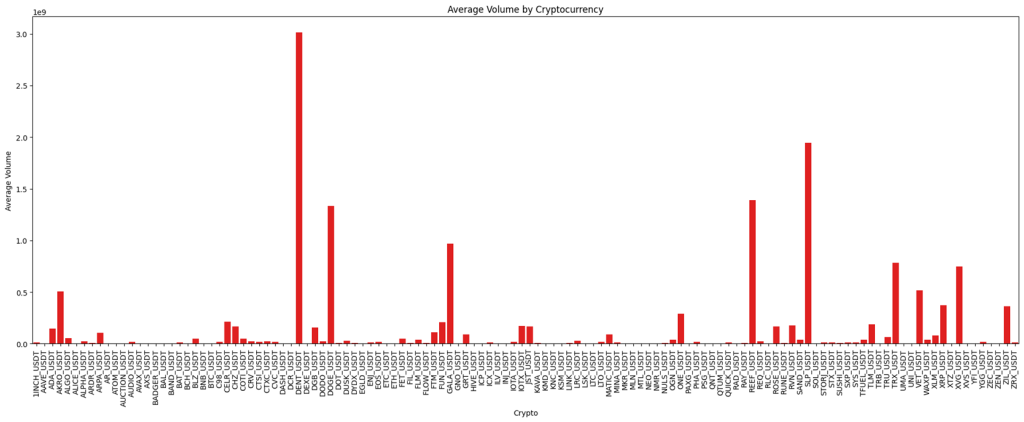
Based on this image which shows the average Volume per token, the following are the list of five tokens with the highest average Volume scores from 2021 till now :
- DENT_USDT
- SLP_USDT
- REEF_USDT
- DOGE_USDT
- GALA_USDT
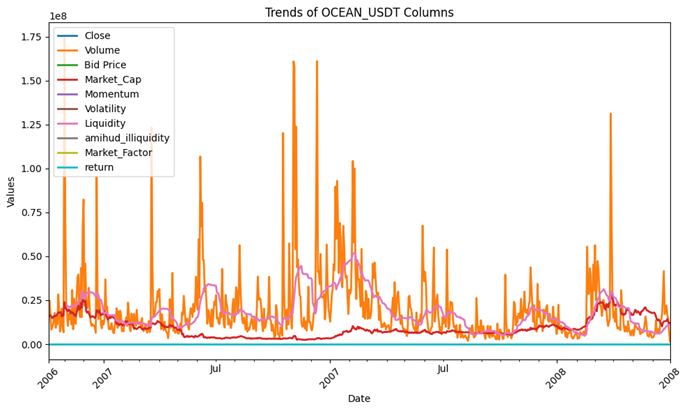
the following barchart shows different factors for 3 specific AI cryptos including : OCEAN(Ocean Protocol), NMR (Numer-ai), AGIX (SingularityNET)
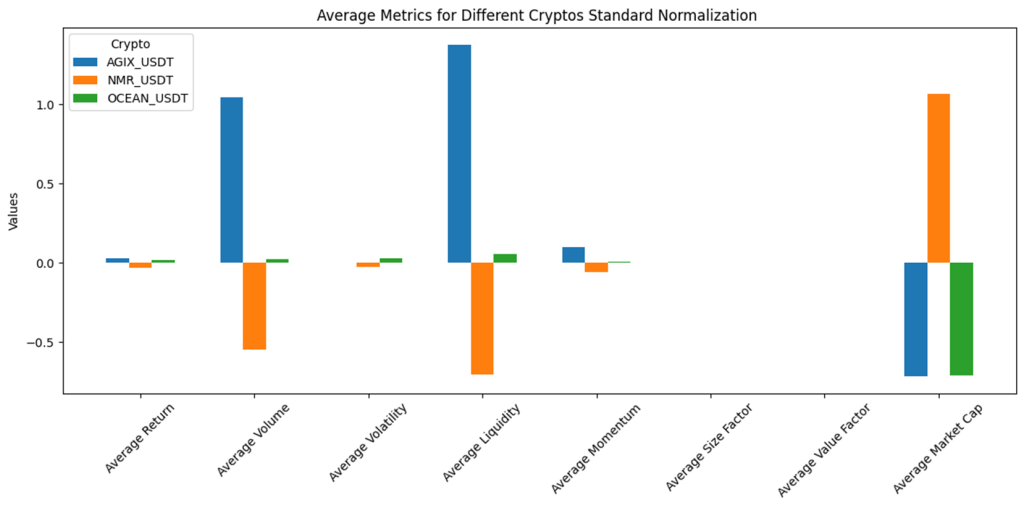
Looking at the chart
- AGIX (SingularityNET) shows strong performance in volume and liquidity metrics, suggesting it’s quite actively traded and easy to buy/sell in the market.
- NMR (Numerai) stands out with a notably high value factor, though it shows lower performance in volume and liquidity. This might indicate it’s viewed as more of a value investment.
- OCEAN Protocol seems to maintain relatively stable, moderate levels across most metrics, without extreme highs or lows, suggesting it might be the most balanced of the three.
Time Lags
Here we’ll analyze different time lags between different factors and token return to find the ones that maximize correlation. This will help us identify any lagged effects between different factors and token return movements. we defined 10 lags from 0 to 9 to investigate where each two metrics has the maximum correlation.
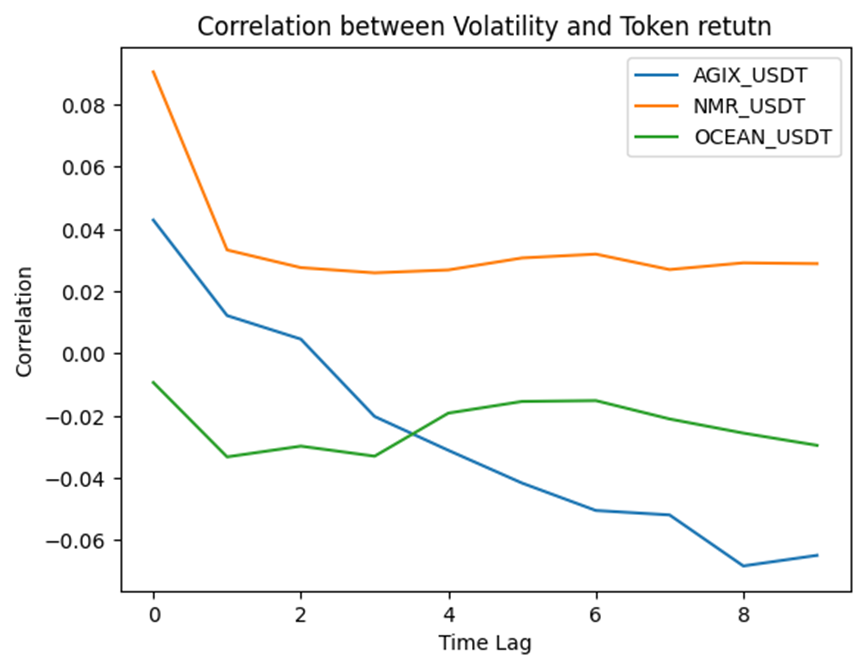
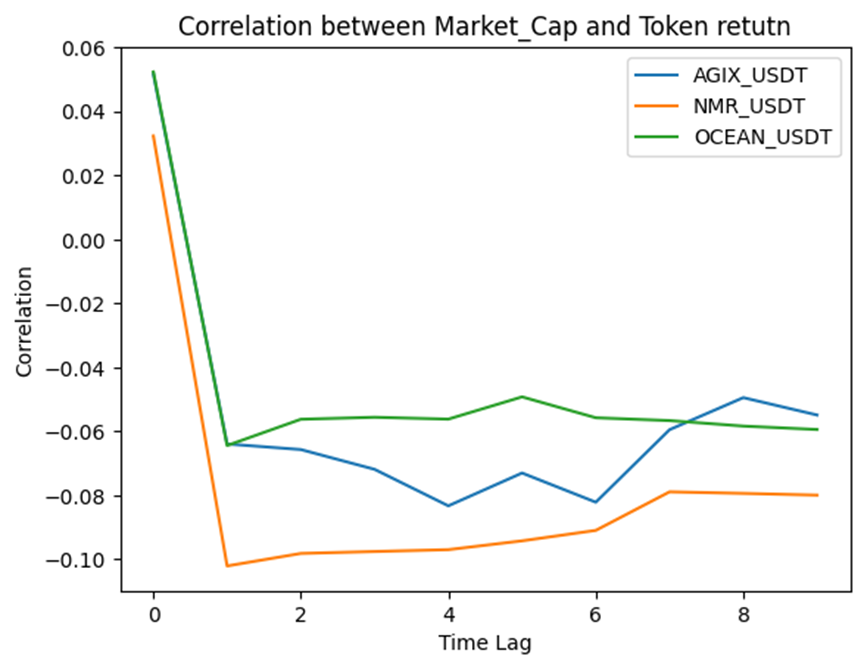
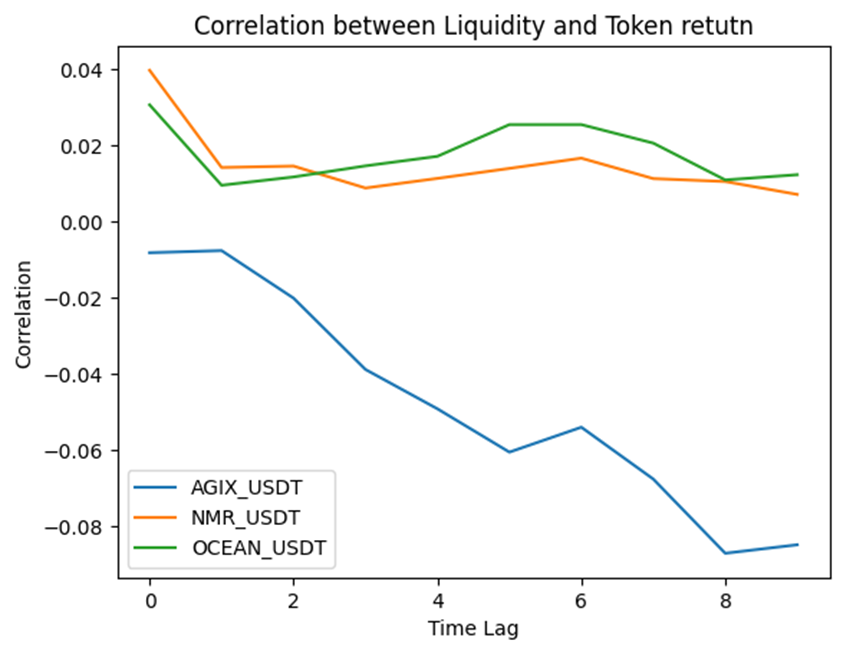
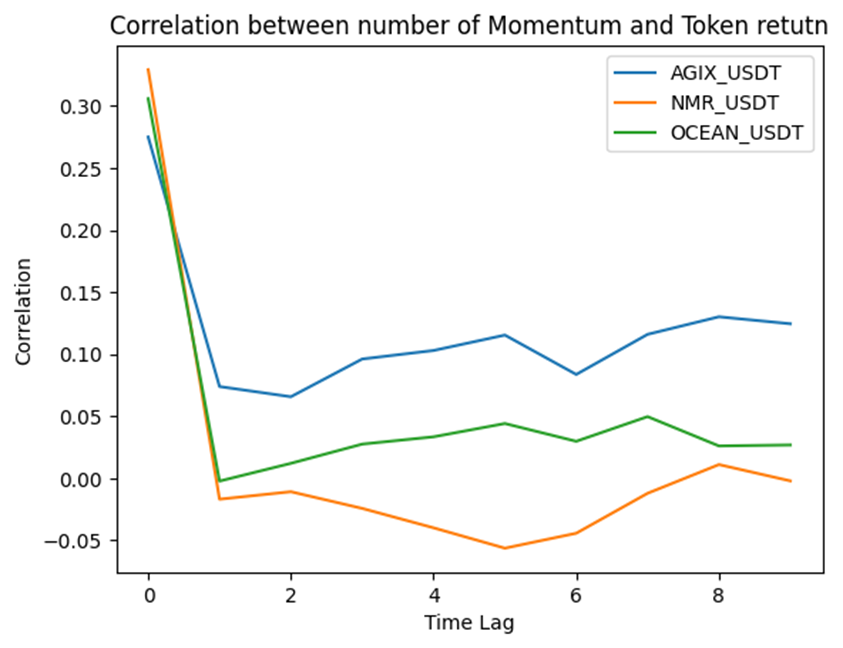
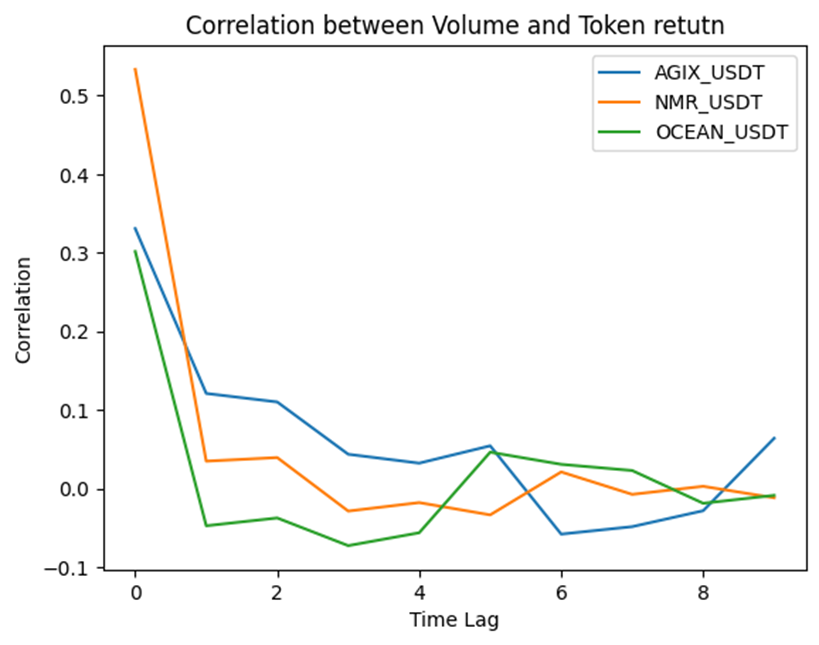
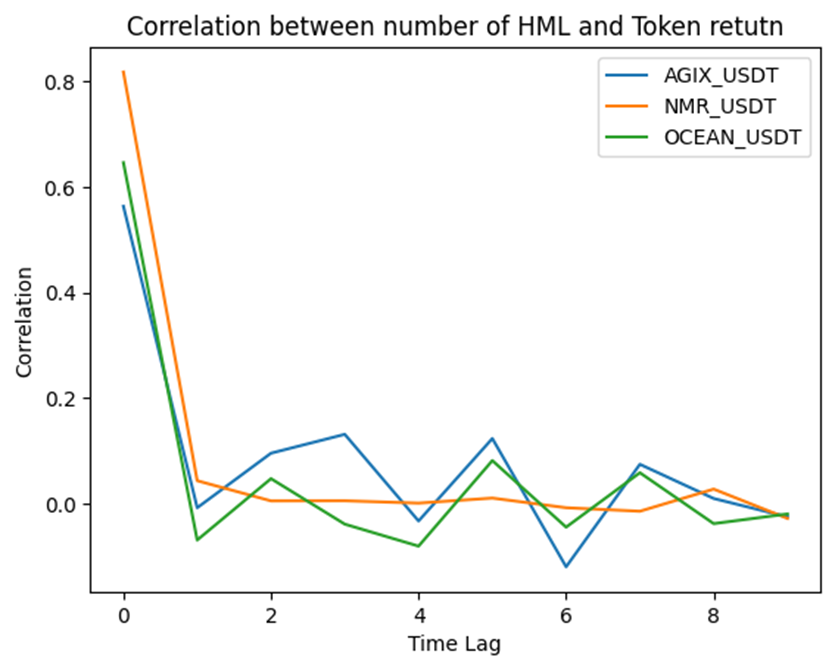
These images illustrate that in lag =0 the correlation is maximized for all factors (except of AGIX- return and Liquidity which is maximized in lag 1 ) which implies that these factors are significant drivers of token returns in the short-term (without any time delay). This could suggest that any fluctuations in these factors immediately influence the returns of these cryptocurrencies. In practical terms, the prices react to the factors on the same day or instantaneously, showing a strong relationship between the two at this specific point in time.
Models
We applied Ordinary Least Squares (OLS) regression which is a fundamental statistical technique used to analyze the relationship between different factors and crypto price return. OLS models are widely applied in various fields of economics, social sciences, and finance to understand and predict outcomes based on input data. We examined OLS model with different setups like economic factors as input , google trends as input and their combination as input.
Economic and Market Factors
The OLS regression analysis have been performed on a combined dataset of all 128 cryptos which are concatenated alongside each other. with 1000 sample for each crypto our combine dataset has 128000 samples with economic and market factors as features. The datasets in this model containing economic factors without google trend since their join was empty without overlap in time. This model explores what factors influence crypto returns. Based on R-squared metric, the model can explain approximately 54.2% of the variability in returns which indicated that these factors couldn’t well predict the return.
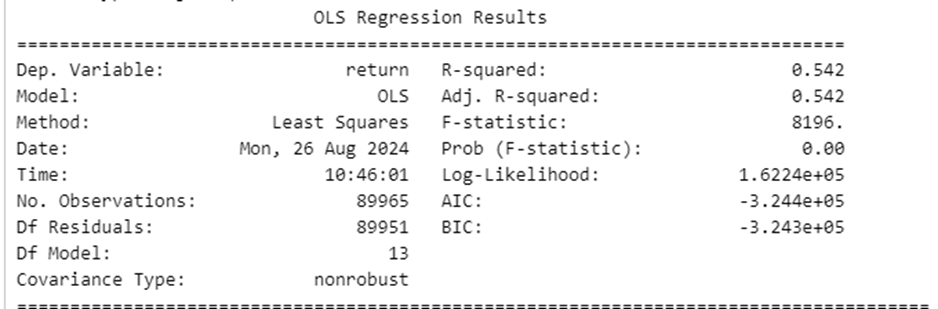
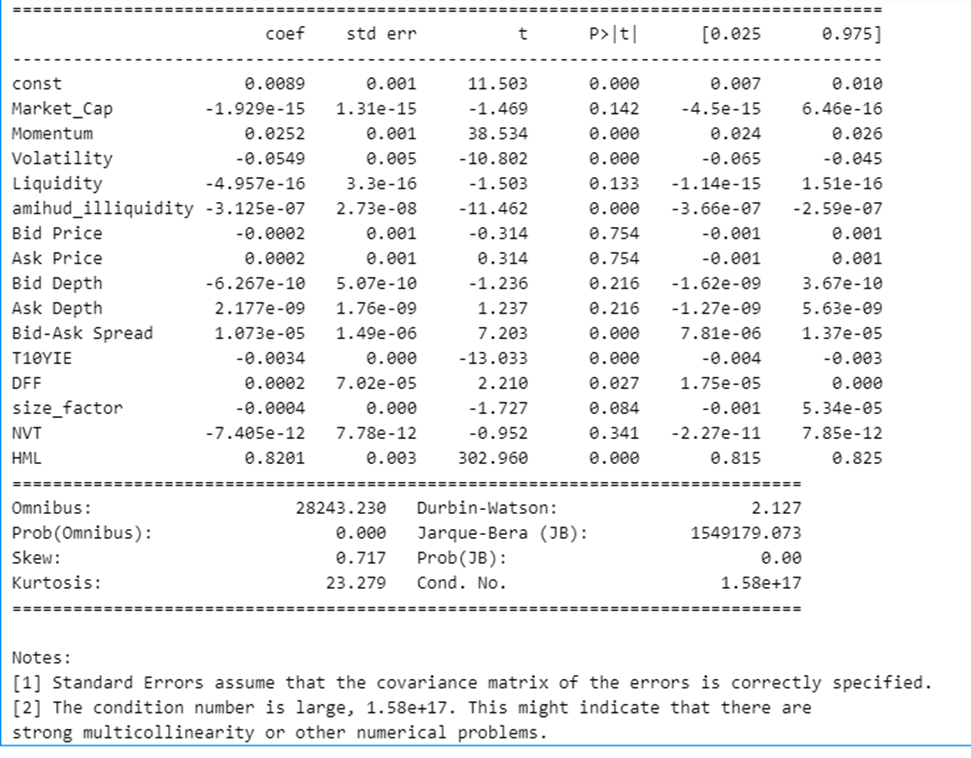
Significant Factors:
- HML (High Minus Low): This factor has a strong positive impact on returns and is highly significant.
- Momentum: This factor is marginally significant, suggesting it may slightly influence returns.
Insignificant Factors: Other variables, such as Economic Factors do not show a significant effect on returns.
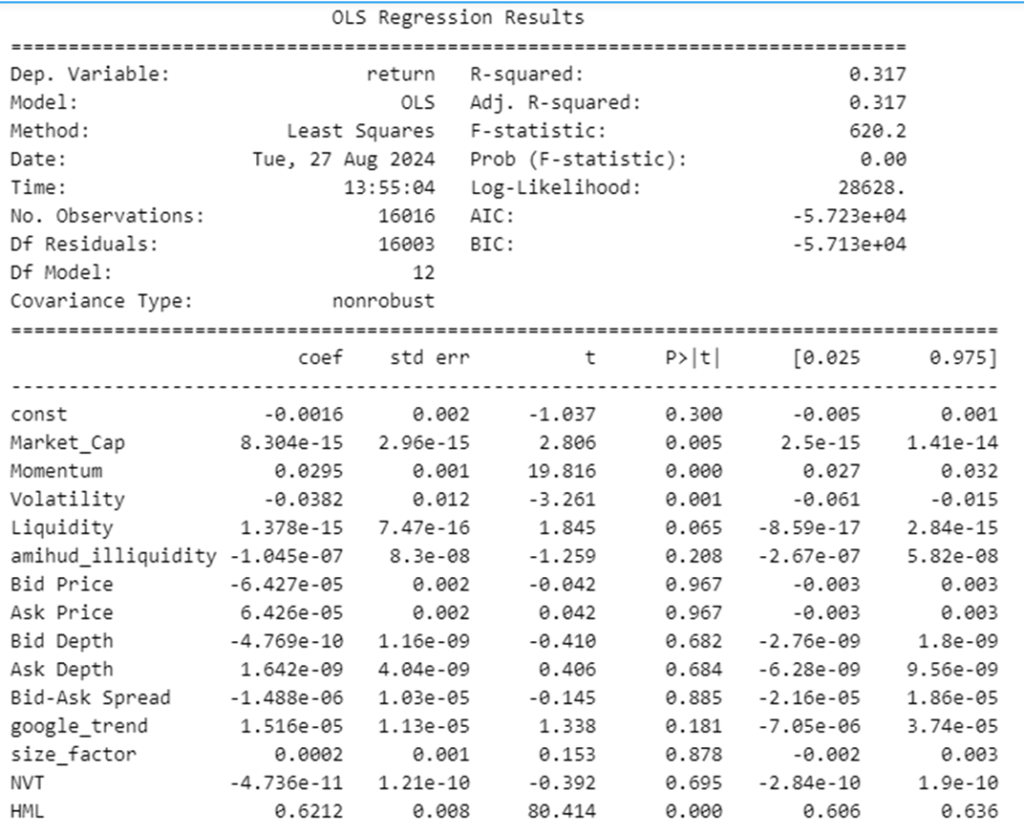
Google Trends and Market Factors
One more time we applied the OLS regression analysis on a combined dataset of all 128 cryptos, but this time only with google trends and market factors as features (without economic factors). The model shows that about 31.7% of the changes in returns can be explained by the model’s factors. As before, the higher momentum (with low impact) and HML (high minus low) values are linked to increased returns, while higher volatility (with low impact) tends to decrease returns. The model is statistically significant overall, but indicates that google trends do not significantly affect returns.
Single AI-based Cryptocurrencies
We also run OLS model on each of three AI token with 1000 samples : SingularityNet (AGIX_USDT) , Ocean Protocol (OCEAN_USDT) and NumerAI (NMR_USDT)
SingularityNet (AGIX_USDT):
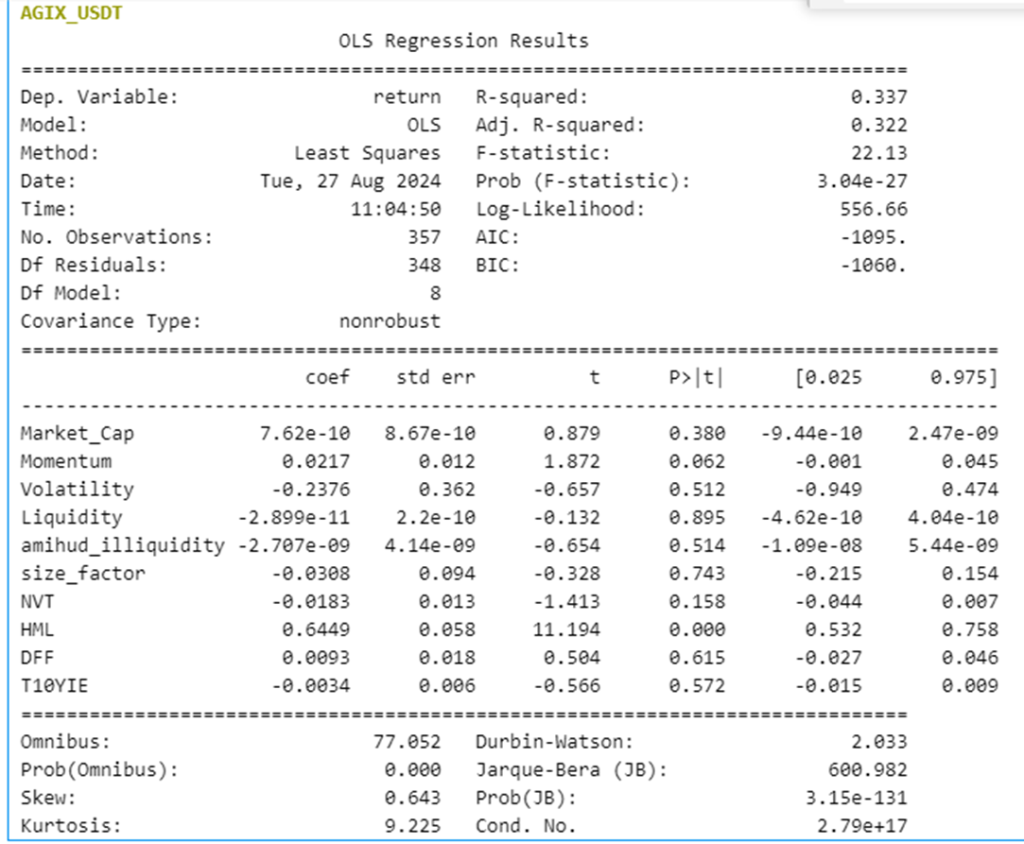
the model explains about 33.7% of the changes in returns, which means it captures some, but not all, of the factors affecting AGIX’s performance. The same as before the most impactful feature is HML with Coefficient: 0.6449 , t-statistic: 11.194 and P-value: 0.000 (highly significant). This is by far the most statistically significant variable and has the largest coefficient, suggesting it has the strongest positive impact on returns. The second most notable factor is also Momentum which shows a weak positive relationship with returns with Coefficient: 0.0217, t-statistic: 1.872 and P-value: 0.062 (marginally significant at 10% level). The rest of the features show little to no significant impact.
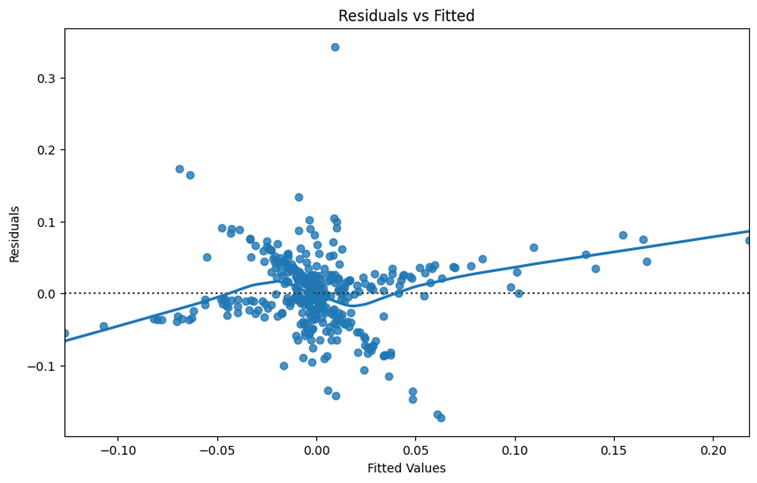
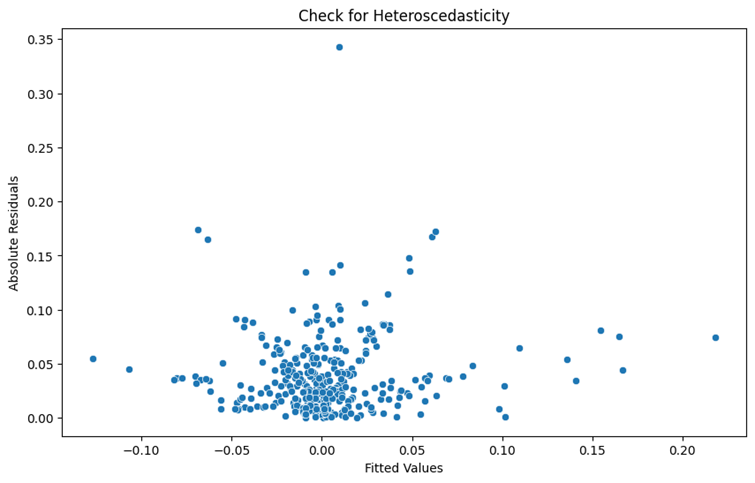
these two images illustrate Residual vs Fitted values and Heteroscedasticity (meaning the variance of residuals changes with the fitted values)of model. Using residual vs fitted we can analyze the data and model from different aspects
- Linearity: The residuals appear to be randomly scattered around the horizontal line (y=0), which is a good sign and suggests that the linearity assumption is reasonable for the model.
- Homoscedasticity: The points in Heteroscedasticity plot appear to be randomly scattered, though there might be some clustering around the 0 mark. This suggests no clear heteroscedasticity.
- Outliers: A few residuals are notably far from the rest, particularly on the higher side. These could be outliers or influential points that might affect the model’s performance.
Ocean Protocol (OCEAN_USDT)
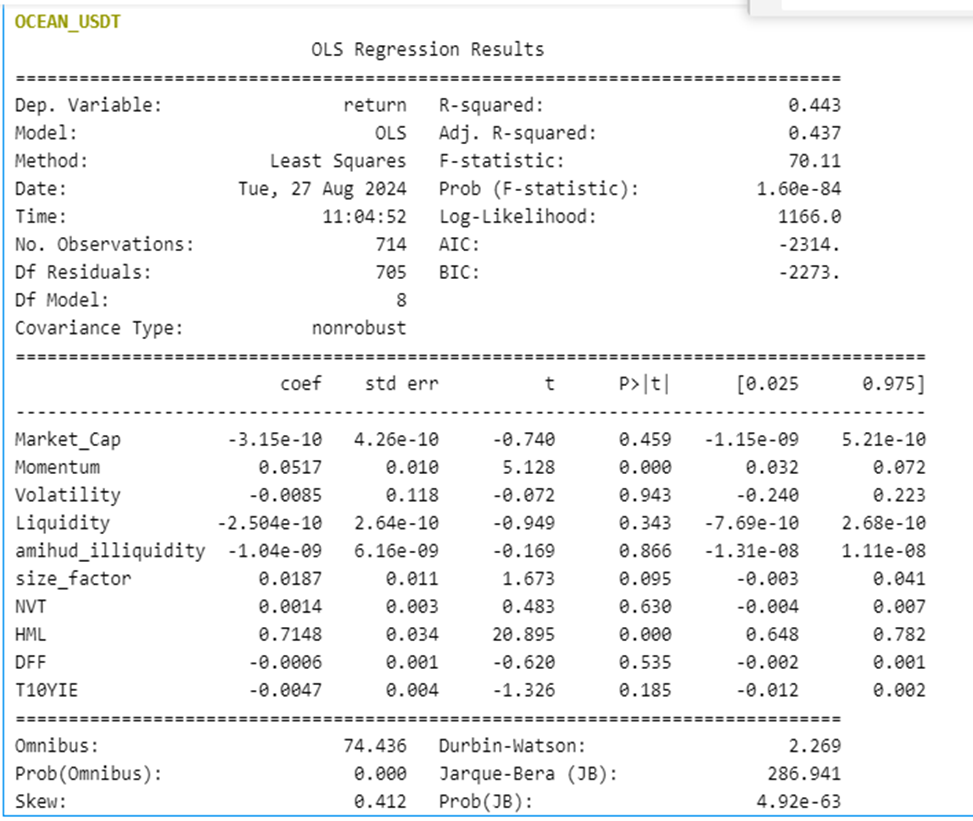
The OLS regression results on Ocean Protocol (OCEAN_USDT) show an R-squared value of 0.443, indicating that approximately 44.3% of the variability in returns is explained by the model. The adjusted R-squared is slightly lower at 0.437, suggesting a reasonable fit but leaving room for other factors or complexities not captured by this model.
Key factors include momentum, with a significant positive coefficient (0.0517) and a p-value of 0.000, indicating a strong relationship with returns. The HML factor also shows a significant positive effect (0.7148) with a p-value of 0.000. Other factors like market cap, volatility, liquidity, and others have high p-values, suggesting they are not statistically significant in this model.
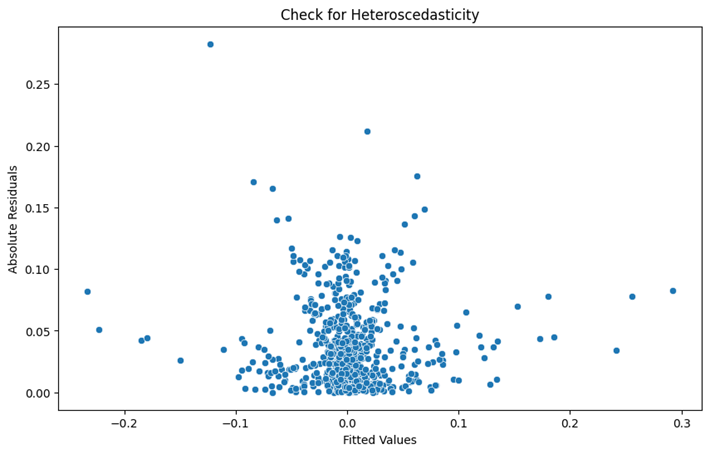
The two plots for Ocean Protocol show a slight funnel shape, which suggests that the spread of the errors (residuals) increases as the predicted values go up. Ideally, the errors should be randomly scattered around the horizontal line with no clear pattern, indicating that the model fits well.
However, since the errors spread out at different levels of predicted values, it suggests that the model might not fully capture all the important patterns in the data. This means there is still room to improve the model or include more factors to make it more accurate.
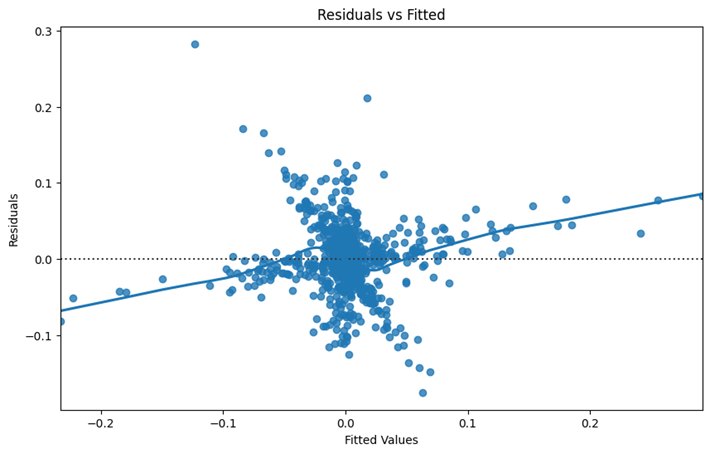
NumerAI (NMR_USDT)
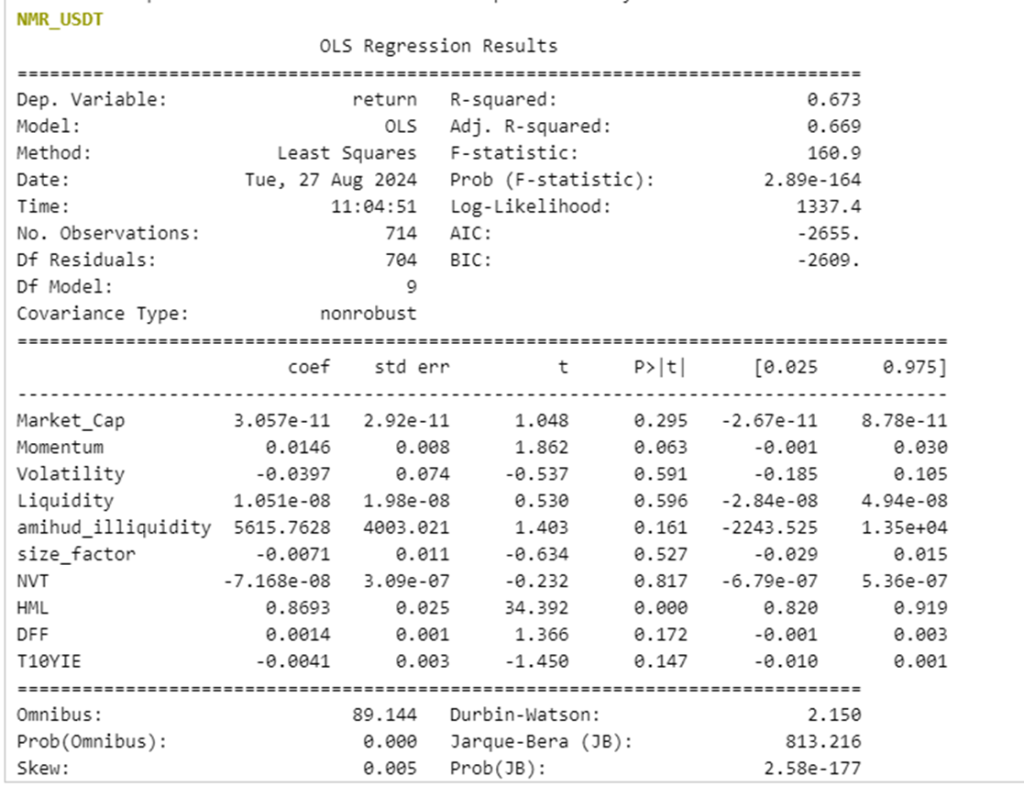
The model explains about 67.3% of the variability in NMR returns, indicating a good fit.
HML and Momentum are the most impactful factors in predicting Numerai return. Other variables, such as Market Cap, Volatility, Liquidity, and others, do not show a significant effect on returns.


Based on these two plots :
- Linearity: The plot shows a slight curve rather than a random scatter, indicating potential non-linear relationships not captured by the model.
- Outliers: A few points are far from the zero line, suggesting the presence of outliers or influential observations.
- heteroscedasticity: there is no strong evidence of heteroscedasticity, as the spread of residuals appears fairly constant across the range of fitted values.
Final Tips and Conclusion
This work provides a comprehensive analysis of various factors influencing cryptocurrency returns, emphasizing the importance of market and economic indicators. The significant correlation between HML and momentum with returns suggests that these factors should be prioritized in investment strategies. Following tips indicate how we can improve the work in the future.
- Given our access to a limited dataset spanning only three years, the analysis lacks comprehensiveness and cannot address every aspect of the subject matter. Expanding the dataset to include a broader time frame would enhance the depth of the investigation
- Factors such as sentiment data and social media activity can significantly influence the returns of individual tokens. By evaluating a wider array of factors, we can better understand their collective impact on returns, leading to more informed insights into cryptocurrency performance.