In previous part we studied the dataset of Formula 1 one by one. We realized that the dataset contains the data of 15 race events which took place in 2024, with total 21 drivers in 10 teams who took part in these events. In this part we’re going to do a bit more EDA and investigate the relationships between different variables in detail. keep an eye on the screen and join us in this breath-taking races of cars.
The following topics are covered in this post :
Exploratory Data Analysis (EDA)
In this section, we are going to answer the pre-defined questions that were listed in Evaluation Criteria section of this challenge.
Q1 : For each driver and team in each race of the 2024 F1 season, determine the total number of pit stops made. Identify any patterns or trends in pit stop frequency.
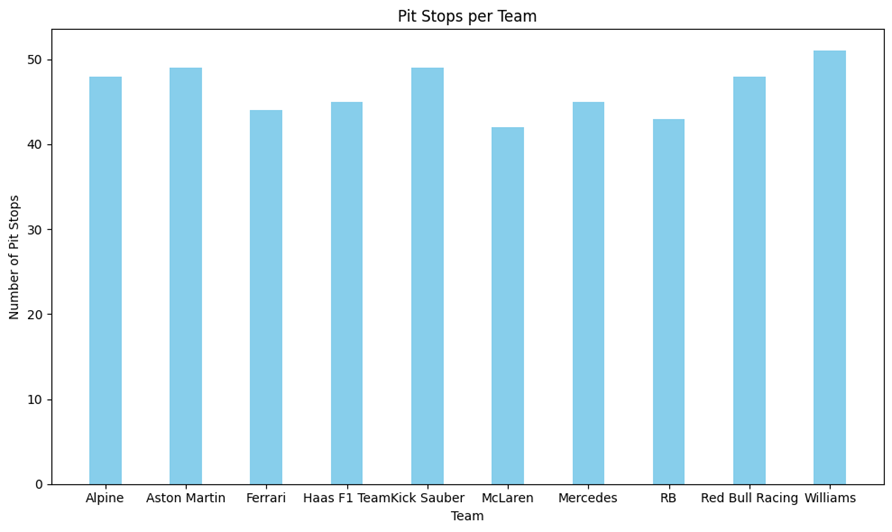
For this part, we used visuals and drew two bar plots one for teams and one for drivers.
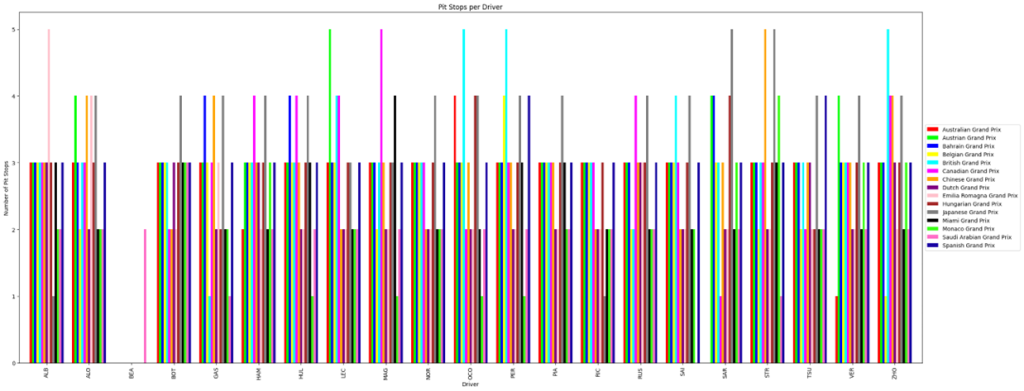
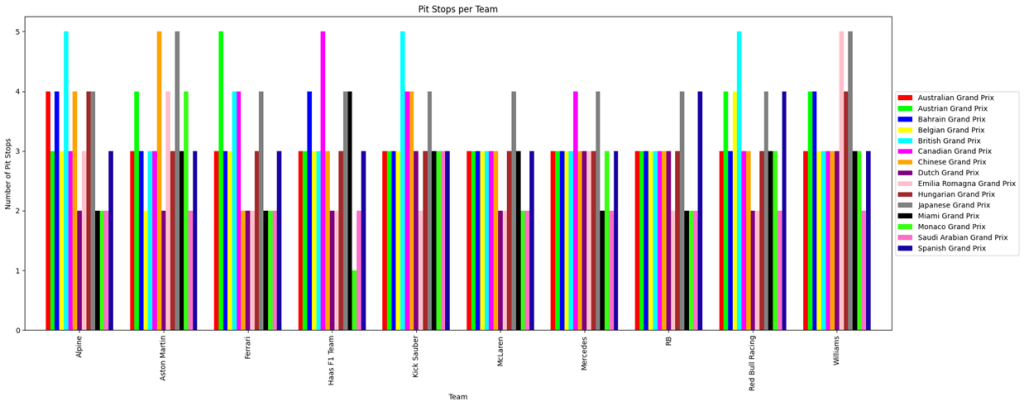
The Y-axis of these plots shows the number of pit-stops for each driver/team during the race and the X-axis you can see the name of drivers/teams. From the above charts ,
- only 9 drivers/teams have stopped in 5 pits (the tallest lines). three of these lines with the cyan color correspond to the British Grand Prix, two of the lines with gray color are related with Japanese Grand Prix and the remaining lines of 9 lines are related with other events.
- however, the number of 4 pit-stops in the events, is far more than 5 pit stops
- based on the first bar plot, Ric and Alb are the only drivers who haven’t had 4 pit-stop at all in any of races. Bea has only attended on one race (Saudi Arabian GP)
- Most drivers/teams had 2 or 3 Pit Stops in each event
- by looking closely we see that Haas F1 team is the only team with 1 pit- stop in Monaco GP
Q2 : For each driver and team in each race of the 2024 F1 season, determine the total number of pit stops made.
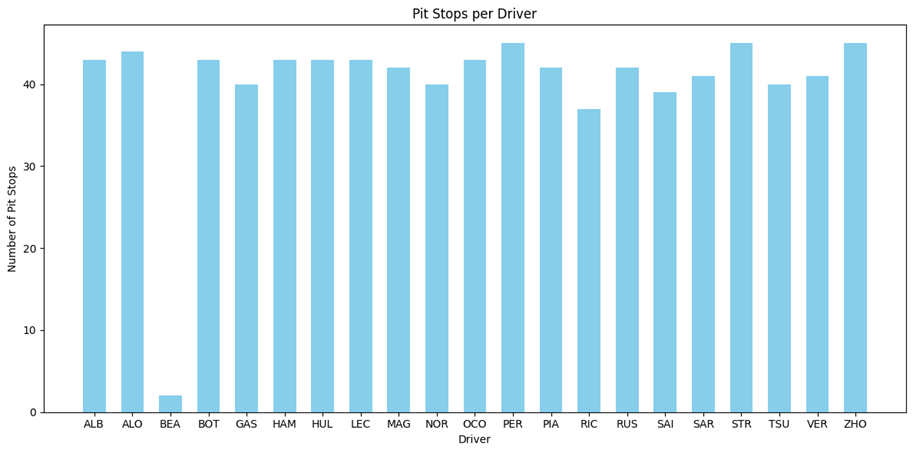
These charts illustrate total number of Pit-Stops per driver (the right) and team (the left) over all 2024 events.
- All drivers except BEA had about 40 Pit-Stops just a few less or more that indicates their strategy in pit stops are relatively the same.
- BEA is the only driver with 2 pit-stops and that’s because he only participated in Saudi Arabian GP
- the average number of pitstops by teams are 45 , where Williams team took the most number and RB took the least number of pitstops
Q3 : Identify the tire compounds used by each driver in every race. Create visualizations to compare the tire compound strategies across different teams and drivers.
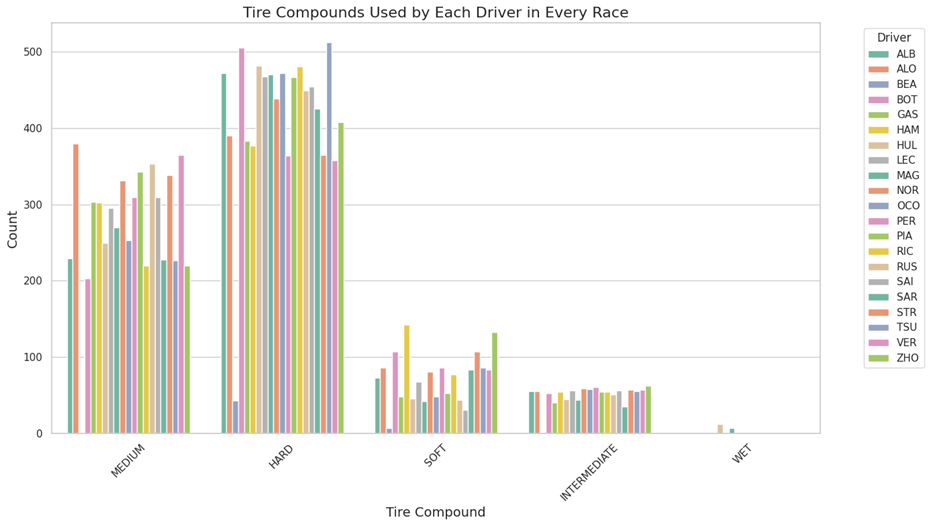
This chart shows the total number of tire compounds used by each driver during the 2024 events. The hard compound was the most popular choice, with drivers using it an average of 400 times. Next up is the medium compound, which was used about 250 times on average. The soft and intermediate compounds were used less frequently, with each being used around 50 times on average. Lastly, the wet compound was only used by 2 drivers, indicating that rainy conditions were quite rare throughout the season. Overall, it looks like drivers favored the hard and medium tires for most of their races!
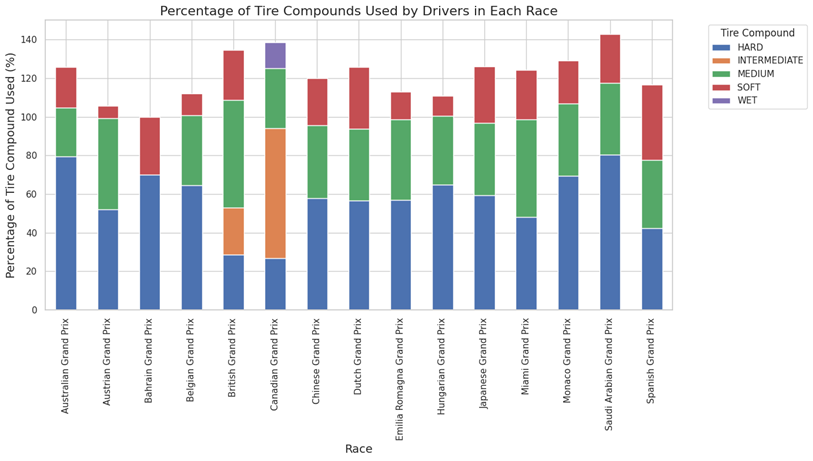
This one shows the percentage of tire compounds used by drivers in each race. The blue and green sections represent the hard and medium compounds, which were the most popular overall. The intermediate compound was notably used in just two races: the British and Canadian Grands Prix, mainly due to rainy weather. The soft compound was used in every race but less frequently than hard and medium tires. The wet compound appeared only in the Canadian GP, indicating rain during that race.
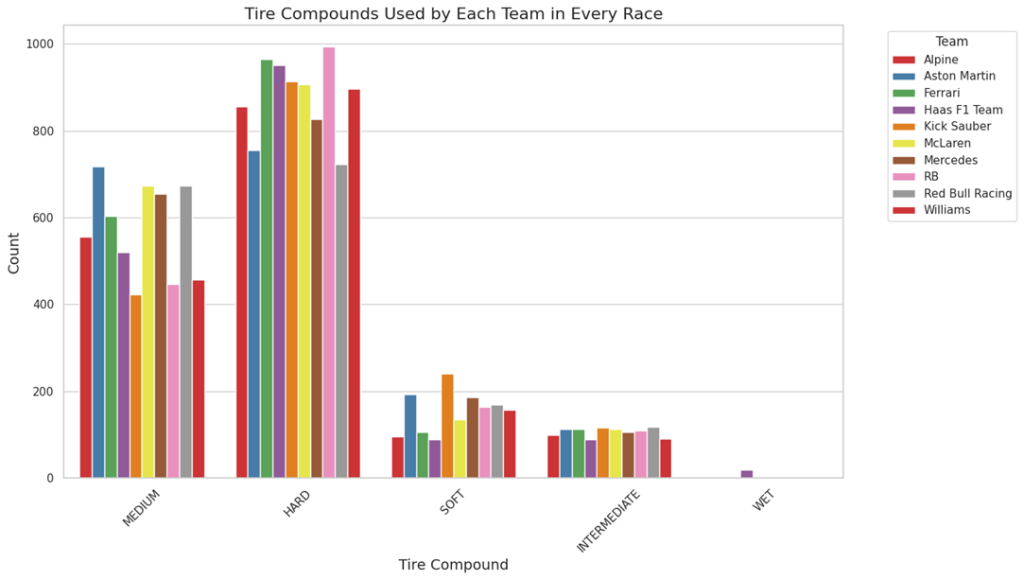
This chart illustrate total number of particular compound which has been used by each team in 2024 events. It illustrates that hard is the most frequent used compound by each team more than 800 times and after that medium is in the second place.
Both soft and intermediate are used less than 200 times by teams and wet has been used only once by Haas f1 team.
Q4 ) Analyze the number of laps completed by each driver on each tire compound during their stints. Use visuals to illustrate the relationship between stint length and tire compound usage.
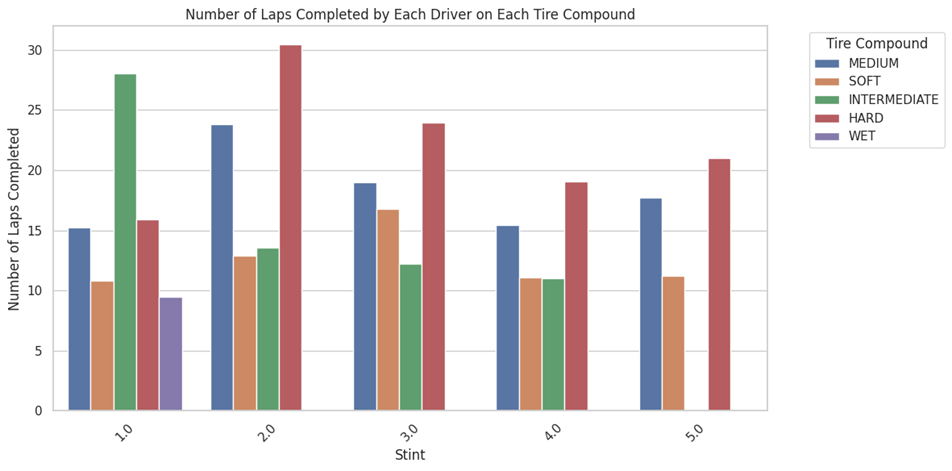
Each bar in the figure represents the stint number and the tire compounds used during that stint. In the first stint, the intermediate compound achieved a maximum of 28 laps, outpacing all other compounds. The medium and hard compounds each reached 15 laps, while the soft compound managed 10 laps and the wet compound completed 9 laps.In stints 2 to 5, the hard compound dominated, achieving the highest number of laps overall. Notably, in the second stint, the hard compound exceeded 30 laps, marking it as the most successful single compound performance across all stints.
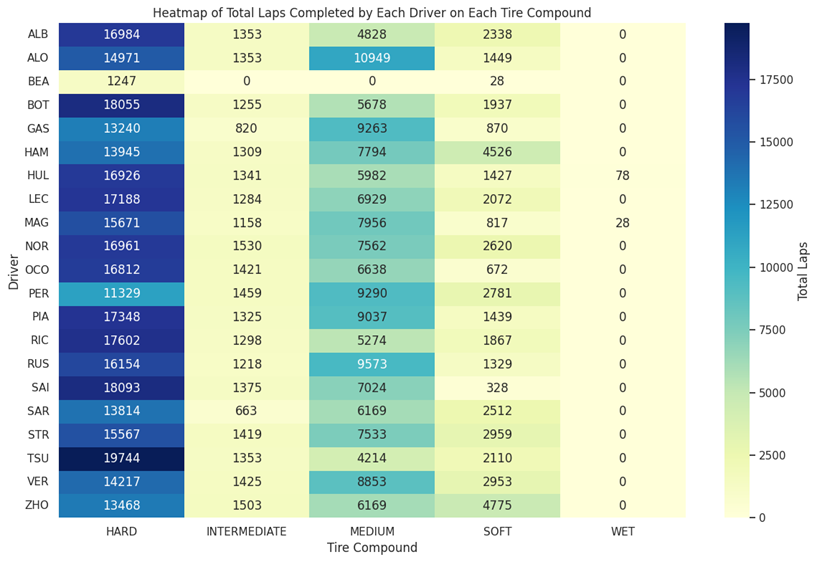
the figure shows the number of completed laps on each compounds per driver in all 2024 races.
- Nearly 15000 laps are completed by each driver in hard compound.
- about 7000 laps are completed by each driver with medium compound as the second most frequent compound.
- TSU has completed the most number of laps with 19744 on hard compound
- ALO has completed the most number of laps with 10949 on medium compound
- HAM has completed the most number of laps with 4526 on soft compound.
Q5 ) Use visuals to illustrate the relationship between stint length and tire compound usage.
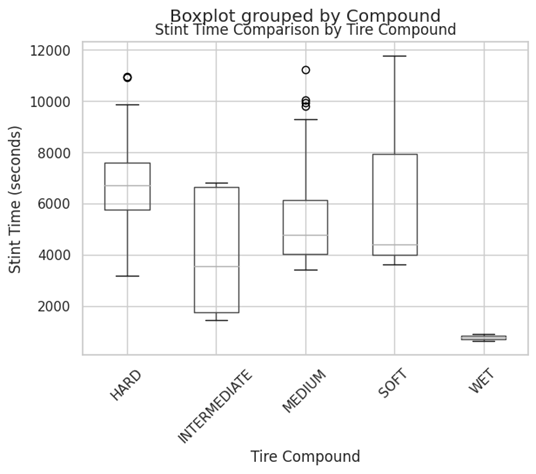
Based on the box-plot which illustrate stint time on each tire compounds:
• Wet tires show shortest and most consistent stint times (~1000-1500s), used only in wet conditions
• Hard tires demonstrate longest median stints (~6000-7000s), reflecting their durability
• Soft tires have the widest time range (4000-12000s), showing high strategic variability
• Medium and Intermediate compounds show similar median times but Intermediates have more variation
Q6 ) Calculate the average lap time for each stint. Visualize the changes in lap times within each stint to understand how tire performance evolved over the course of a race.
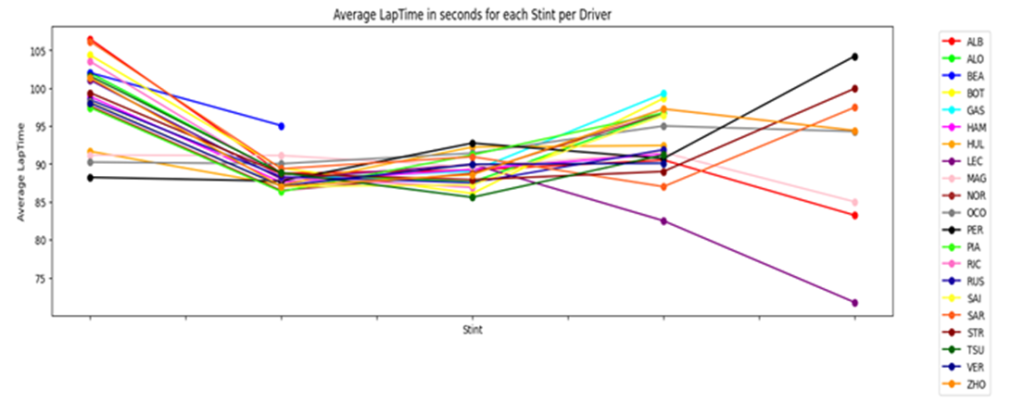
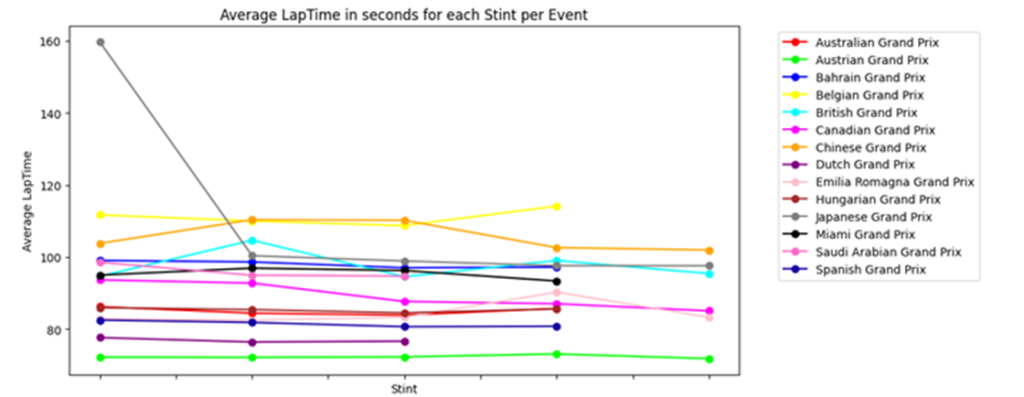
These figures illustrate average lap time in each stint per driver (left) / per 2024 event(right).
- Totally most drivers have spent much time in first stint
- second and third Stints drives have spent the same time on that.
- in the last two stints(4 and 5) drivers have choses different strategies. in the last Stint specially , some drivers decided to go as fast as they can while some of them reduced their speed.
- Generally in each events, spent time in different stints are almost similar without any sharp changes.
- in Japanese event, in the first, drivers spent too much time in first stint (maybe a car accident or unpredictable event happened) but after that they have drove their car much faster in a uniform trend
Relationships
R1 )Investigate how different tire compounds (e.g., Soft, Medium, Hard) correlate with lap times throughout the race.
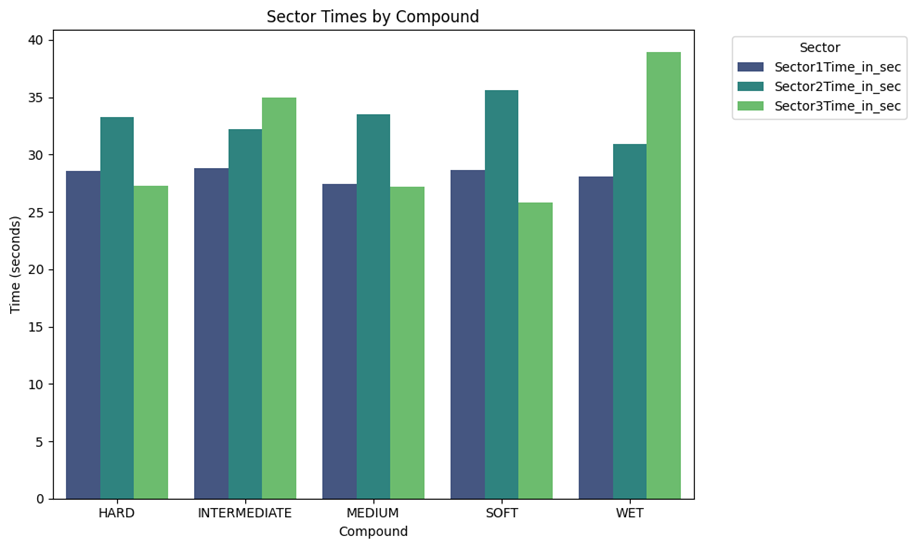
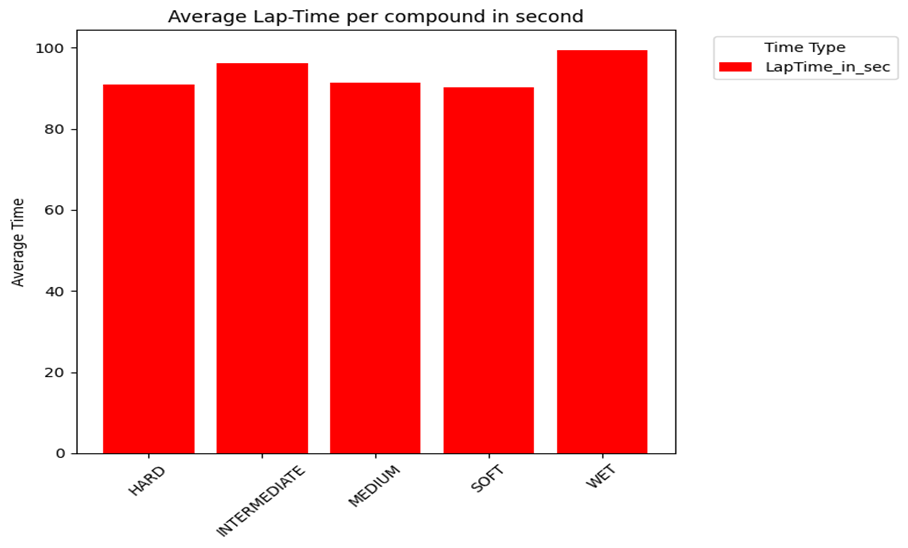
Based on these two image which shows average lap-time spent on each compound:
- HARD: Times are relatively lower specially in sector 3
- INTERMEDIATE: Times are generally higher, particularly in Sector 3.
- MEDIUM: Shows a balanced performance, with times lower than hard in 2 and higher than hard, soft and intermediate in sector 3 .
- SOFT: Shows a balanced performance, with times lower than others in sector 3 and higher than other in sector 2 .
- WET: Has the highest times, indicating slower performance in all sectors.
- HARD and MEDIUM compounds are more consistent in longer stints due to durability but are slower in terms of outright lap time.
R2 ) Explore how starting the race on different tire compounds (Hard, Soft, Medium) impacts the final classification
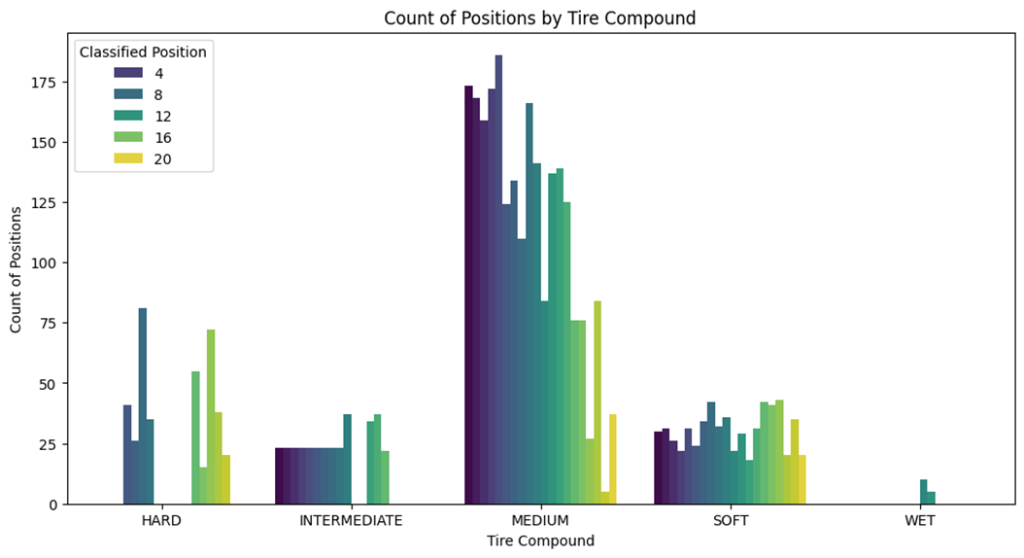
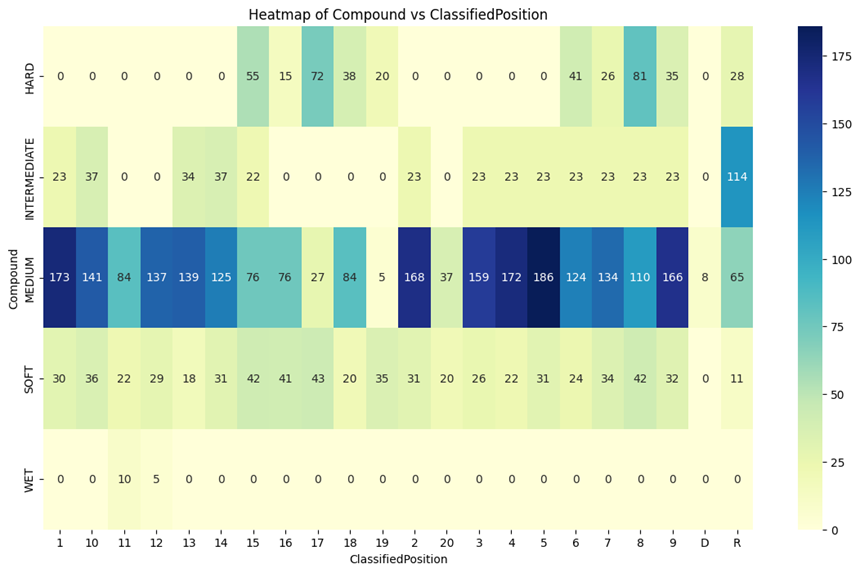
The images shows the number of drivers achieved each position on a particular compound in the begging of the race. Based on the images :
Hard Compound: Not frequently used for top positions and More common in mid to lower positions (15th and above).
Medium Compound: Most frequently used across all position. Significant number of top ten finishes, especially from 3rd to 10th have used it.
Soft Compound: Also used frequently, but less than Medium and achieves good results in top ten finishes, with some wins and podiums. It Offes competitive results, useful for aggressive strategies, especially when track position is critical.
R3) Explore the relationship between the number of laps driven on a particular tire compound and the delta time (change in lap times) over those laps.
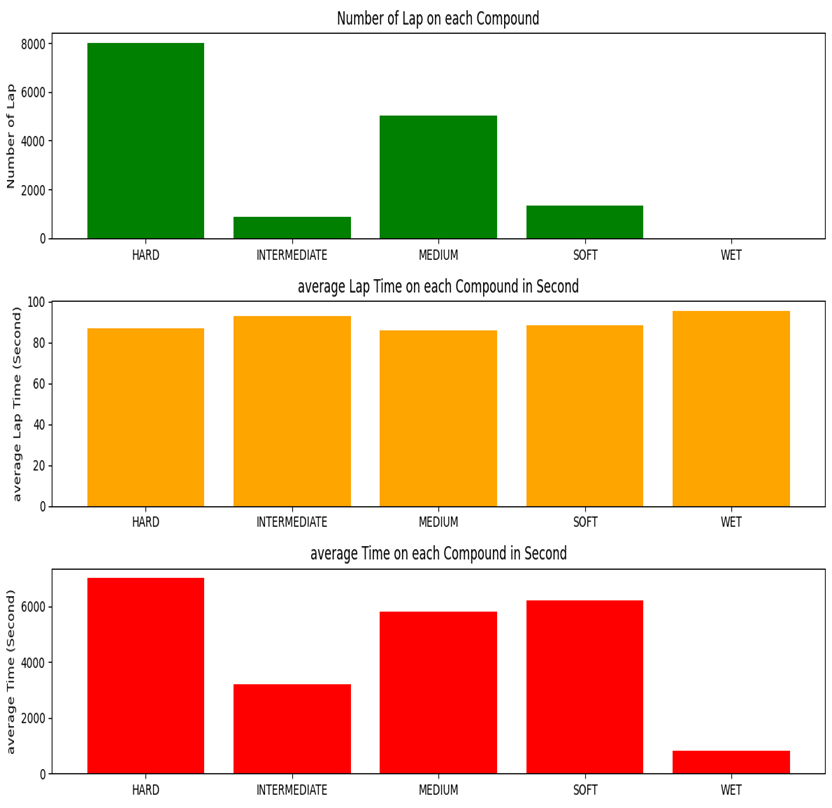
The image shows three bar charts that relate to tire compounds used in racing. green bar shows lap number , yellow bars shows average lap time and red bars shows average time in seconds.
- Hard tires are used for longer stints (more laps) but are not necessarily the fastest.
- Hypersoft tires allow for faster individual laps but are used less frequently.
- Intermediate, medium, and soft tires provide a balance between durability and speed, showing moderate lap times and usage.
- Ultrasoft and wet tires are typically used in specific conditions, resulting in fewer laps and distinct performance characteristics.
R4) Explore the relationship between the Weather and adopted Strategy in total
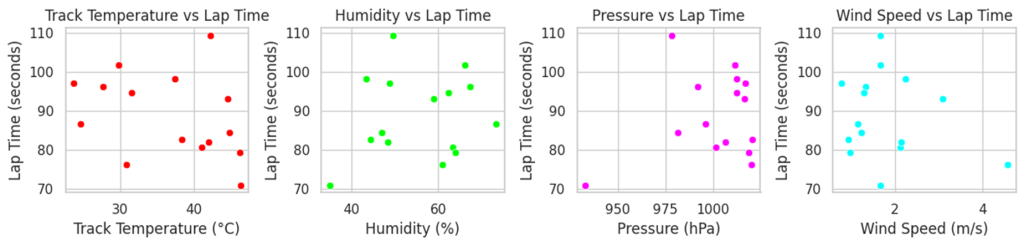
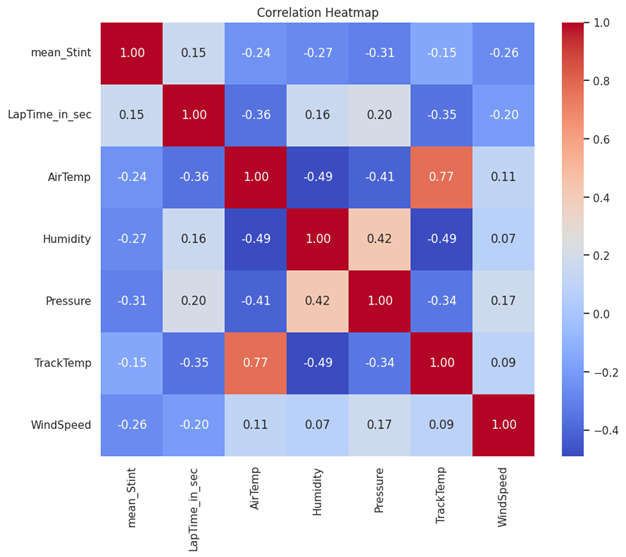
The correlation heatmap revealing how weather conditions impact performance. Key findings include a moderate negative correlation between lap times and both track and air temperatures, indicating that higher temperatures generally lead to faster lap times, while humidity tends to slow them down slightly. Track temperature shows a strong positive correlation with air temperature, and a moderate negative correlation with pressure. Other correlations are weaker, such as the minimal impact of wind speed on lap times and temperature. This data offers valuable insights for teams to optimize strategies and car setups based on varying weather conditions.
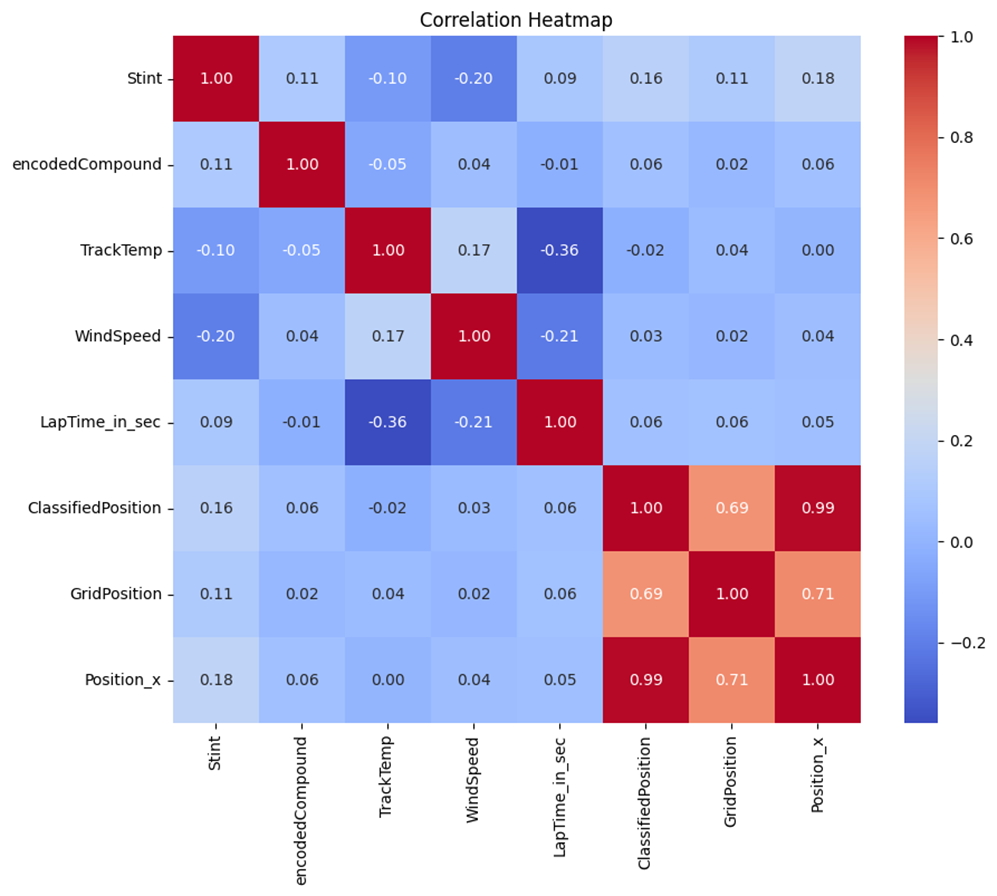
Grid Position and Final Position: There’s a strong positive correlation between GridPosition and ClassifiedPosition. This means that where a driver starts on the grid significantly impacts their final position. Drivers starting at the front are more likely to finish in higher positions.
Lap Time: LapTime_in_sec shows a moderate positive correlation with ClassifiedPosition, indicating that faster lap times generally lead to better final positions.
Track Temperature and Wind Speed: These factors seem to have little to no correlation with the final position, suggesting that they might not be as critical in determining race outcomes.
Tire Compounds: EncodedCompound has a slight impact on GridPosition. The choice of tire compounds can influence race strategy and performance.
Stint: The number of stints (periods between pit stops) also shows some correlation, indicating that pit stop strategy plays a role in the final outcome.