Formula 1, the pinnacle of motorsport, is not only a thrilling spectacle but also a rich source of data ripe for analysis. By examining datasets related to Laps status, weather, results and other race factors, we can uncover insights into the factors that influence race outcomes and team strategies. This analysis allows us to delve deeper into the environmental and technical aspects that affect performance on the track, providing a comprehensive understanding of how these variables interplay in the high-stakes world of F1 racing.
In this post, we’ll study and analyze the data from different aspects and in the next posts will apply a comprehensive EDA and investigate the relationships between various factors and in the end we will train different ML models to predict the Mexico City competition result.
Stay With Us …
Here is the list of contents we are going to cover in this blog post :

Explanation of F1 term and Strategy: Laps, Tires, and Pit Stops
In Formula 1, strategy plays a critical role in determining race outcomes. While a driver’s skill and the car’s performance are paramount, how a team manages tires, pit stops, and race timing can make the difference between winning and losing. Below is a comprehensive guide to understanding the key strategic elements of F1 racing, particularly focusing on laps, tires, and pit stops.
1. Tires and Their Importance
Tire Compounds:
- Soft (Red): Offers the most grip but wears out quickly. Ideal for qualifying or short stints in the race where speed is essential.
- Medium (Yellow): A balanced tire that provides a mix of durability and performance. Often used as the default tire during a race.
- Hard (White): The most durable tire but with the least grip. Suitable for long stints and managing tire wear over extended periods.
- Intermediate (Green) and Wet (Blue): Used in wet conditions. Intermediate tires are for light rain or drying tracks, while wet tires are for heavy rain and standing water.
Tire Degradation:
- Wear: As a tire degrades, it loses grip, increasing lap times. Managing tire wear is crucial to maintain consistent performance.
- Graining: This occurs when rubber shears off the tire surface but does not wear away entirely, leading to reduced grip. It often happens when tires are not in their optimal temperature range.
- Blistering: High temperatures can cause small blisters on the tire surface, reducing performance.
Pit Stop Timing Strategies:
- Undercut: Pitting earlier than a competitor to gain time on fresher tires, potentially overtaking them when they pit.
- Overcut: Staying out longer on track with the aim of gaining time or positioning, relying on the competitor losing time on worn tires.
2. Laps and Race Timing
Lap Time Management:
- Fuel Load Impact: Cars are heavier at the start of the race due to the fuel load, resulting in slower lap times. As the race progresses and fuel is burned off, lap times typically decrease.
- Tire Management: A driver must balance pushing the car for speed with managing tire wear. Overdriving can lead to quicker tire degradation, necessitating earlier pit stops.
- Track Evolution: As a race progresses, the track often “rubbers in,” meaning grip improves as more rubber is laid down by the tires. This can lead to faster lap times later in the race.
Race Phases:
- Opening Laps: Tire and fuel management are crucial. Drivers may opt for a conservative approach to protect their tires or push aggressively to gain positions.
- Middle Stints: Often the longest part of the race, where strategy around tire management and pit stop timing comes into play. Consistency is key during this phase.
- Final Stint: The last part of the race where drivers often push their cars to the limit. Tire choices and previous management come to fruition here.
3. Pit Stops and Strategy
Pit Stop Timing:
- Pit Windows: Teams typically have a planned “pit window” based on tire performance, fuel load, and race strategy. Deviating from this window can be risky but may be necessary depending on race conditions (e.g., safety cars, weather changes).
- Undercut and Overcut: As mentioned, these are critical strategies around pit stops. Timing a pit stop correctly to undercut a competitor can lead to gaining track position.
Pit Stop Execution:
- Time Lost: A typical pit stop, including the time driving into the pit lane and exiting, can cost a driver 20-25 seconds. The actual time stationary while changing tires is usually around 2-3 seconds.
- Pit Stop Errors: Mistakes in the pit lane, such as a slow tire change or miscommunication, can significantly impact race results.
Multiple Pit Stops:
- One-Stop Strategy: Commonly used to minimize time lost in the pits. However, this requires careful tire management, especially with harder compounds.
- Multiple-stop Strategy: Offers more flexibility, allowing for multiple stints on faster tires but involves a higher total time spent in the pits.
4. Tailoring Strategy to Grid Position
Front-Runners (1st to 3rd on Grid):
- Conservative Strategy: Leading cars often opt for a conservative one-stop strategy, focusing on maintaining position rather than risking overtakes.
- Defensive Pitting: Front-runners may pit earlier to cover competitors and maintain track position.
Mid-Pack (4th to 10th on Grid):
- Aggressive Strategy: Mid-field drivers might use an aggressive two-stop strategy or undercut attempts to gain track position.
- Tire Advantage: Pitting early to gain fresher tires can help in overtaking slower cars or defending against those on fresher tires.
Back-Markers (11th and Below on Grid):
- Alternative Strategies: Drivers starting further back may try unconventional strategies, such as starting on harder tires and running a long first stint to gain track position as others pit.
- Gamble on Weather: Back-markers may gamble on weather changes or safety car periods to make significant gains through well-timed pit stops.
5. Stints
- What is a Stint? A stint is the period during which a driver uses a particular set of tires between pit stops. The length of each stint can vary based on tire wear and race strategy.
- Why Do Stints Matter? The number of laps a driver completes on a set of tires (stint length) affects their lap times and overall race performance. Longer stints on worn tires can lead to slower lap times, while shorter stints may require more pit stops.
6. Lap Times and Delta Time
- What is Lap Time? Lap time is the time it takes for a car to complete one full lap of the circuit. Consistently fast lap times are crucial for a strong race performance.
- What is Delta Time? Delta time refers to the difference in lap times between different laps or stints. Monitoring delta times helps teams assess tire degradation and adjust strategies accordingly.
7. Race Length and Strategy
- How Does Race Length Impact Strategy? The number of laps in a race influences decisions about tire management, pit stops, and overall pacing. Longer races may require more conservative strategies, while shorter races might allow for more aggressive tire choices.
Dataset Overview
In this challenge of Desight we accessed to a rich dataset of formula 1 that includes every lap from 15 races in 2024 with detailed information, including lap times, tire compounds, stint lengths, pit stop timings, and race positions. we were asked to identify and interpret patterns in the data, such as how race length impacts strategy or the influence of tire compounds on lap times. Additionally, the challenge included exploring relationships like how tire choice and pit stop timing affect final race outcomes. Let’s start our work by looking the in a close distance!
2024 Races Car Data:
Car dataset has 6,064,741 records and 12 columns. The image shows features’ detailed info of Car dataset. and shows the number of null-values (missed) and unique values of corresponding column. Red element indicates the data-type of each column and last blue element are the first 5 records of each column. As it can be seen, dataset contains the info of , with total participating in these events. The dataset is really rich without any null values. Source column has just single value (nunique) which indicates that all information are gathered from the car-view.
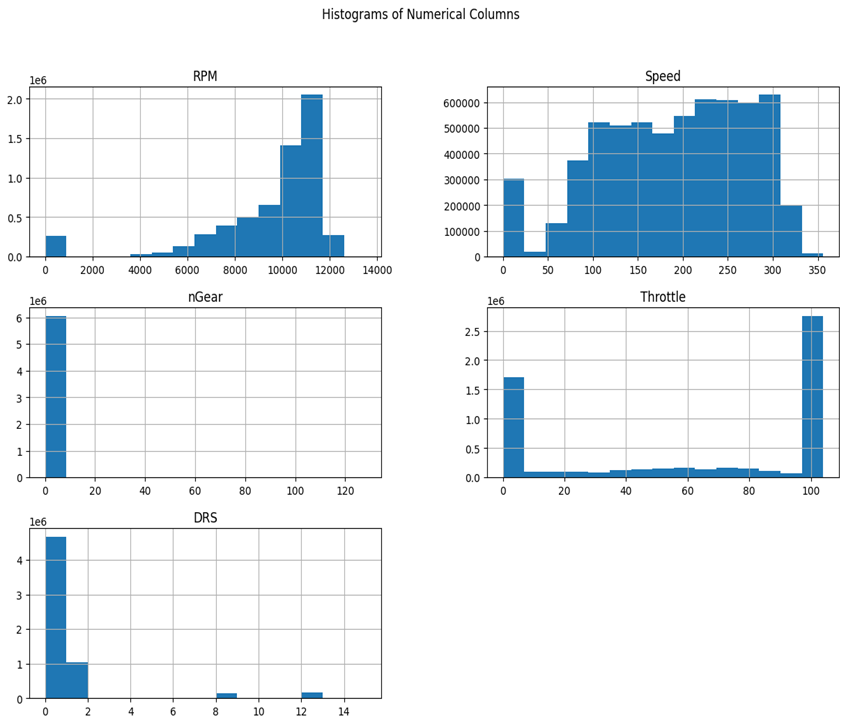
This is histogram plot of car-data numeric columns. based on the charts :
- RPM measures how many times the engine’s crankshaft spins in a minute. In F1, keeping an eye on RPM is crucial for getting the best acceleration and power. From our data, RPM peaks between 10,000 and 12,000.
- Speed ranges from 0 to 350 km/h, but typically sits between 100 and 300 km/h during races.
- nGear shows which gear the car is in, with values from 0 to 128. However, most of the time, nGear stays below 10 across all events.
- Throttle indicates how much the driver presses the pedal. Our histogram shows two main peaks: one near 0% (suggesting braking or coasting) and another near 100% (indicating full throttle during acceleration).
- DRS helps reduce drag for extra speed but is mostly inactive (peaking at 0) since it can only be used in specific zones during races.
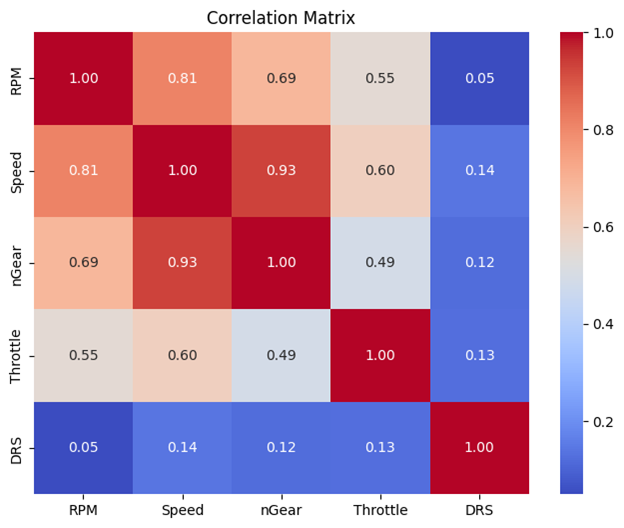
The following pretty table is the Correlation Matrix of Car data numeric features, by looking at it we can derive that Speed, RPM, and nGear are closely related. As expected in a mechanical system like a car, these features are interdependent. Throttle has a moderate impact on both RPM and Speed, which is logical as the throttle controls the engine’s power output.
I think it’s enough with the Car data and it’s the time to check on Laps !
2024 Races Laps Data :
Lap data contains 17123 records with 32 features listed bellow:
EventName, Time, Driver, DriverNumber, LapTime, LapNumber, Stint, PitOutTime, PitInTime, Sector1Time, Sector2Time, Sector3Time, Sector1SessionTime, Sector2SessionTime, Sector3SessionTime, SpeedI1, SpeedI2, SpeedFL, SpeedST, IsPersonalBest, Compound, TyreLife, FreshTyre, IsAccurate, Team, LapStartDate, LapStartTime, TrackStatus, Position, DeletedReason, Deleted, FastF1Generated
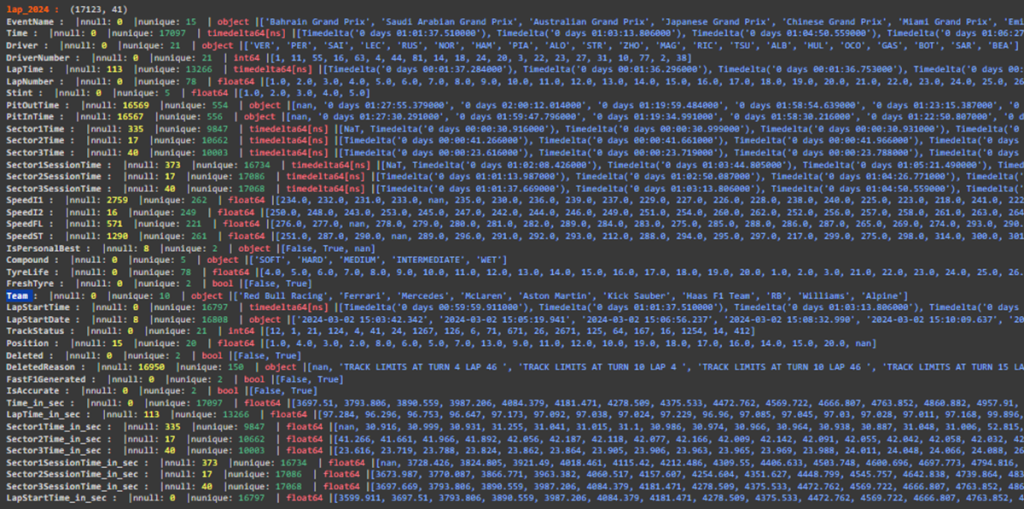
This image shows columns statistics of lap-2024 dataset. Next to each column name , nnull and nunique shows the number of null values and unique values of corresponding column. Red element indicates the data-type of each column and last blue element shows the list of all unique values of the column. based on the image, 96.76% values of PitOutTime and 96.75% values of PitInTime are null. Also SpeedI1, SpeedFL and SpeedST columns have 16.1% , 3.3% and 7.5% null values respectively. Other columns are populated relatively complete. There are 10 Teams, 5 type of tire compound, 5 stints , and the maximum number of laps is 78.
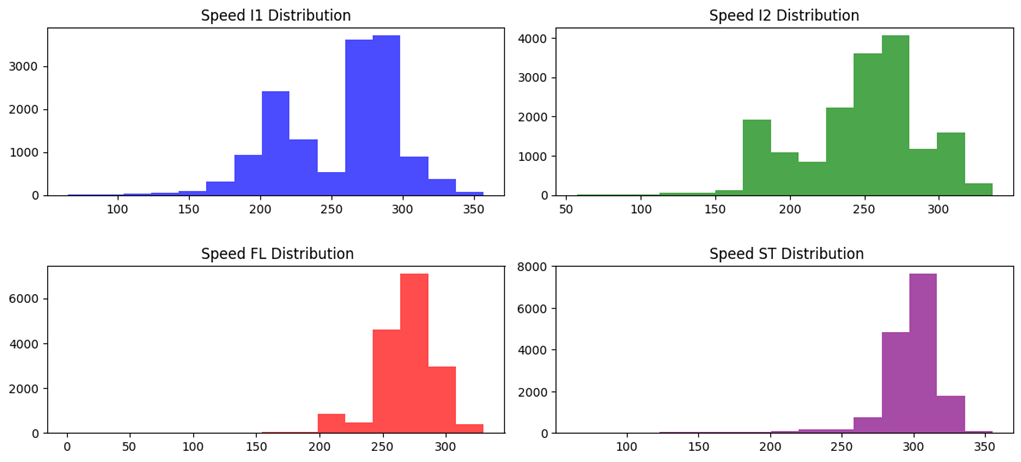
Before analyzing these charts let’s define what Speed-X are.
- Speed I1: Speed trap sector 1 [km/h]. follows a bimodal distribution (two distinct peaks) , This likely indicates two common approaches to the first sector speed trap
- Speed I2: Speed trap sector 2 [km/h]. Shows a wider range of speeds compared to Sector 1. The gradual build-up to the peak suggests this sector might have technical sections where teams take different approaches
- Speed ST: Speed trap on longest straight [km/h] , this metric shows the highest concentration of speeds in a specific range, This makes sense as the longest straight is where cars can maximize their speed potential , The narrow distribution suggests most cars reach similar top speeds on the straight
- Speed FL: Speed trap at finish line [km/h], Very concentrated distribution with a strong peak which suggests teams optimize their cars to hit specific speed targets at the finish line
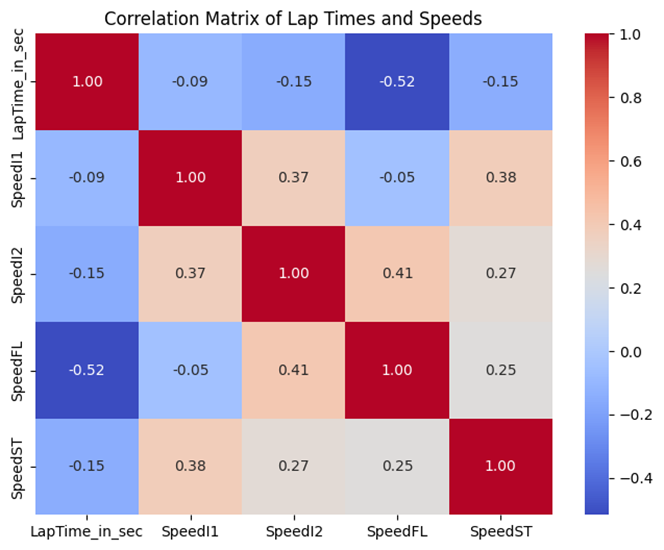
and again the Correlation Matrix! Based on it,
- speed features have negative moderate correlation between with lapTime.
- speedFL with -0.52 is the most correlated feature. It means that have a high speed in finsh line influences on lap-Time decrease more than others.
- the four speed features are moderately correlated with each other.
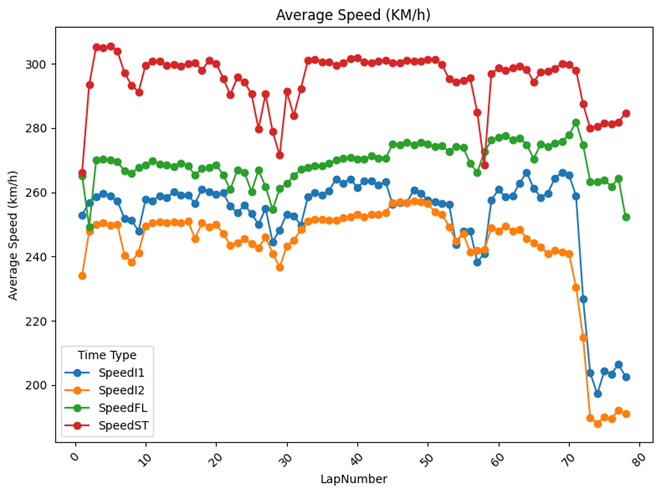
Right figure shows average speed-X per lap :
- Around lap 70, all speeds drop sharply, which could indicate a change in conditions, strategy, or mechanical issues.
- Overall, the speeds remain steady with slight fluctuations, showing consistent performance throughout most of the laps.
- SpeedST (Longest Straight) consistently records the highest speeds above 290 km/h, while SpeedFL (Finish Line) shows stable and high exit speeds onto the main straight, and both SpeedI1 (Sector 1) and SpeedI2 (Sector 2) are lower, with SpeedI2 being the slowest, likely due to tighter corners or technical sections.
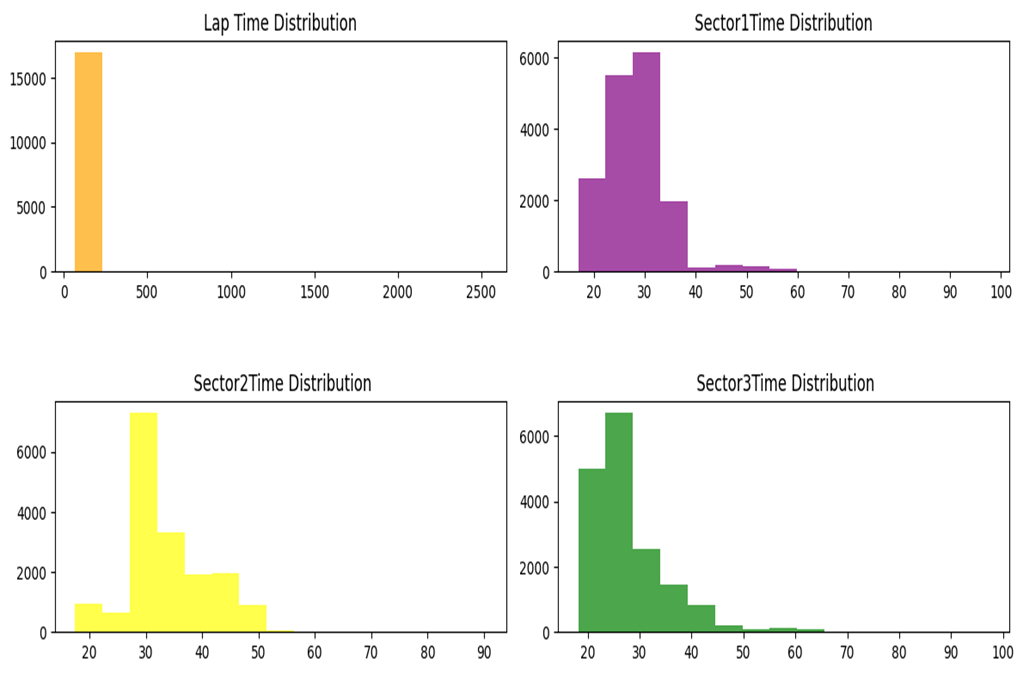
The left histogram plot shows the distribution of lap-time. sector1Time , sector2Time and sector3Time.
- The x-axis shows time in seconds and y-axis is the count of each bins.
- Sector1Time usually take 20 to 40 seconds ,
- Sector2Time 20 to 50 seconds where it peaks at 30 to 35 seconds
- Sector3Time takes 20 to 45 seconds.
- It makes sense since each lap is divided into 3 sectors and lap-time is the sum up of these sectors-time and timing distribution prove this facts.
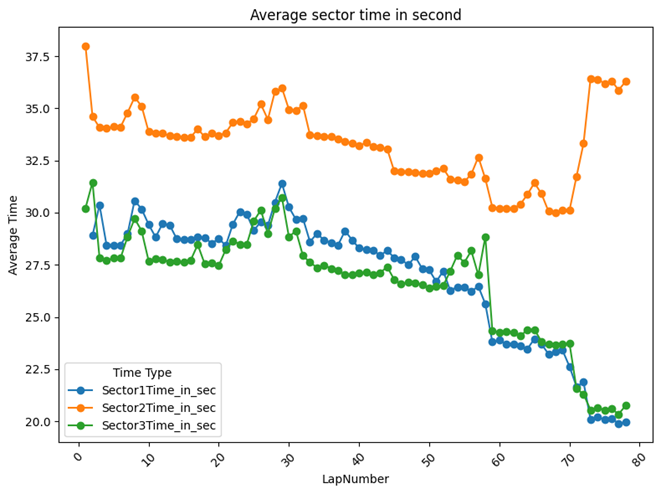
The right graph shows how the average times for three different sectors change over 80 laps.
- Sector 2 consistently has the highest times,
- Sectors 1 and 3 gradually improve and drop significantly after lap 60, suggesting better performance or strategy adjustments.
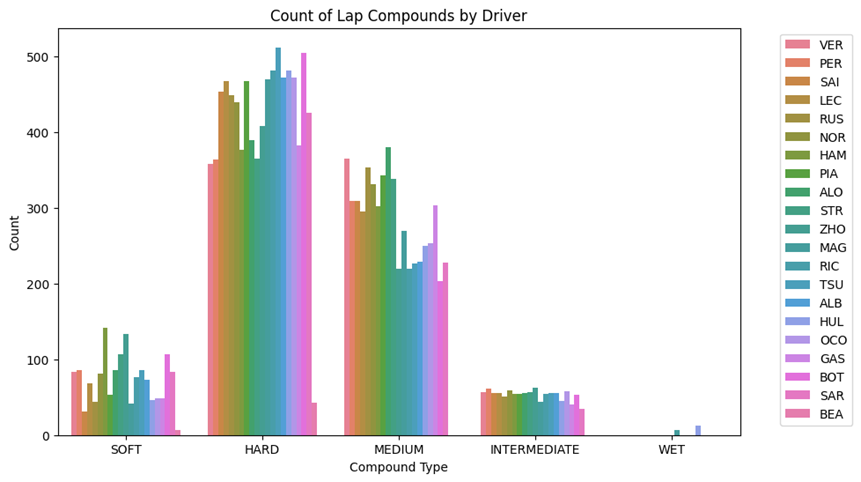
The count plot shows how often different tire types are used by each driver.
- Most drivers prefer Hard and Medium tires, while Wet tires are used the least. Soft and Intermediate tires are also not used as much.
- drivers tend to rely more on harder tires, likely because they last longer.
- The low use of Soft and Wet tires might be due to smart strategies based on the track conditions or race plans. Let me know if you need anything else!
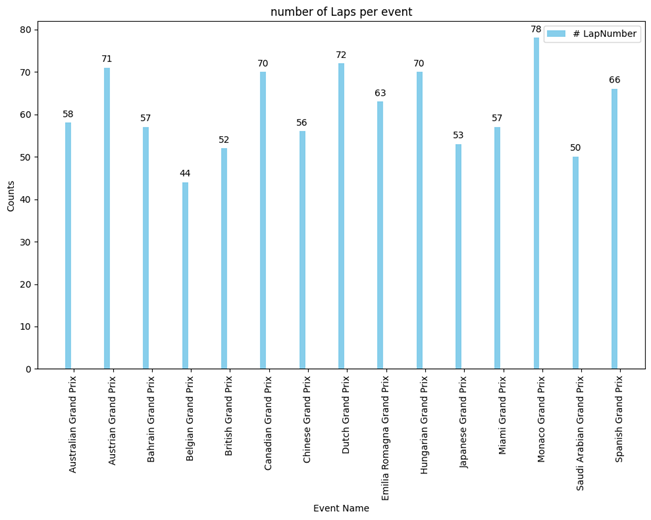
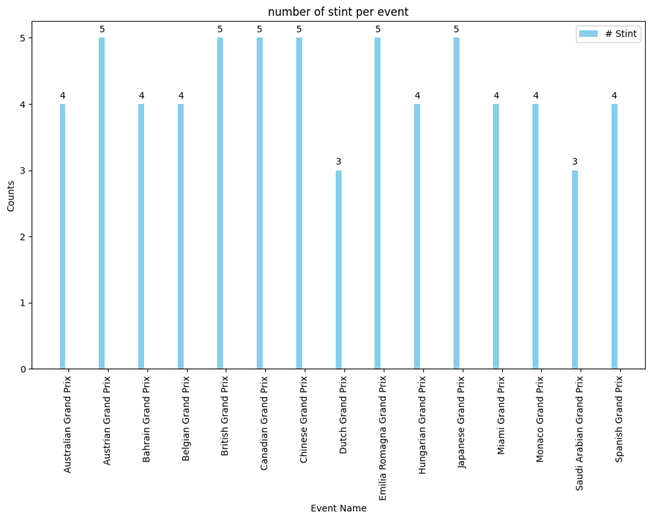
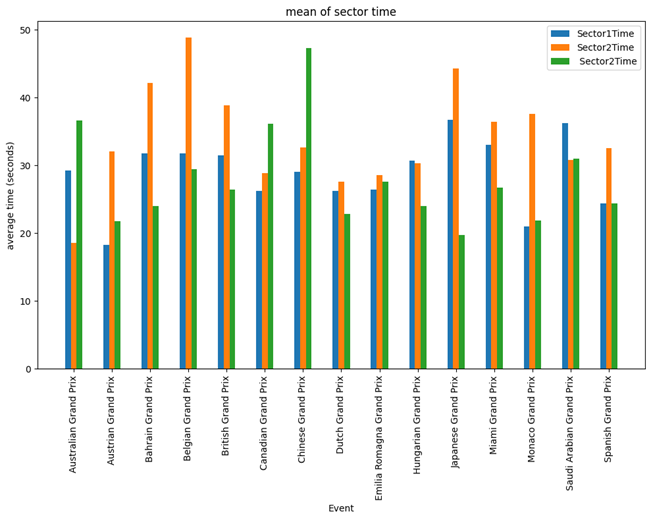
Ah … There is too much to analyze 🙂 … Soooo … What do we have now ?! hmmmm, The upper left figure is the number of laps for each events, the right one shows the number of stints per event and the bottom plot indicates the mean of 3 sector time side by side for each 2024 events.
- Monaco Grand Prix has the maximum number of laps among all event with 78 laps and Belgian Grand Prix has the least number of laps with 44 laps.
- Austrian, Bahrain, British, Japanese , Monaco , Miami , Spanish and Belgian events have spent much higher time in sector2 rather than other two sectors
- Australian , Canadian and Chinese events however have spent more time in sector 1
- Saudi Arabian event on the other hand is the only event which drivers have spent more time in sector1 in average.
- Dutch and Saudi Arabian are the only events with 3 stints. The others have either 4 or 5 Stints
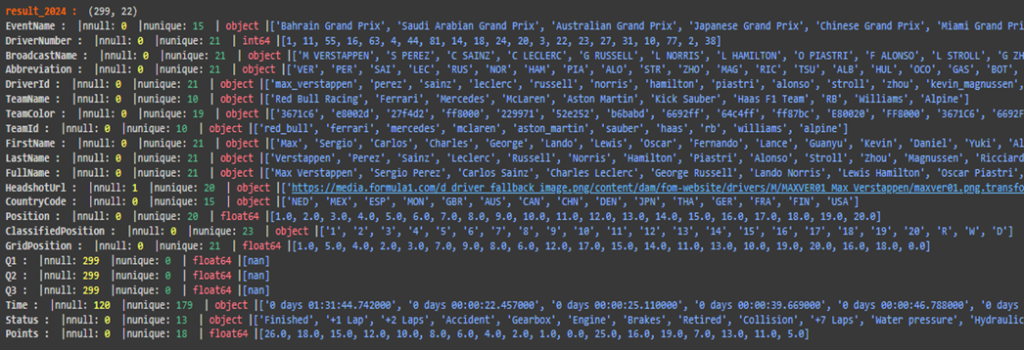
2024 Races Result Data :
Result-2024 data contains 299 rows with 22 features. Three Q1, Q2 and Q3 features are empty without any records. Other features except Time are fully populated.
There are 13 unique values of Status which shows drivers status on a race. Points also determines the total point a driver earns in each race and includes 18 unique values.
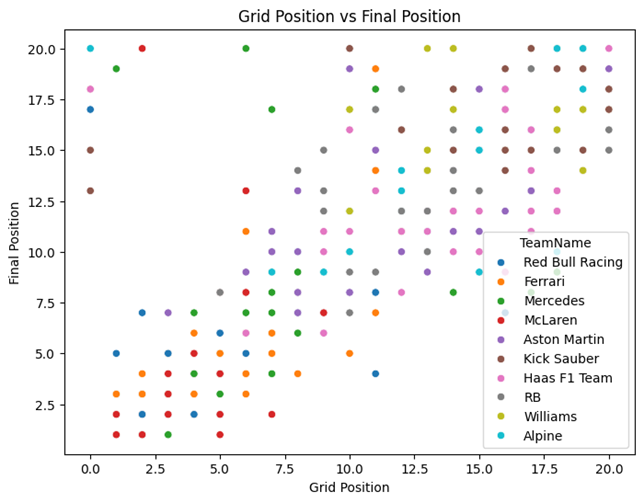
This plot illustrates the correlation between drivers Grid Position in the beginning of each race and their final position at the last of race. Based on the Scatter plot, there is high correlation between these two factors , which mans starting position highly influences on the final result in a race.
The plot shows the correlation for 10 Teams which are initialized with different colors.
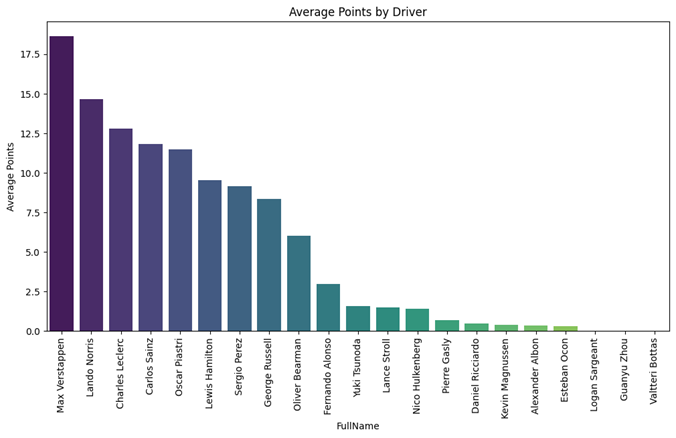
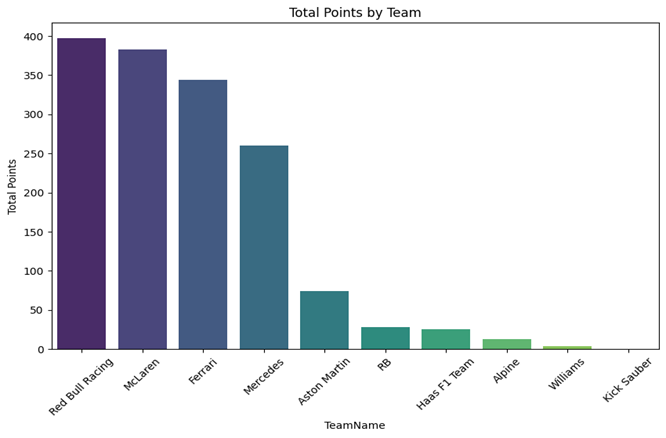
The bar charts show how many points each Formula 1 driver has scored, grouped by their teams. Here are the key points:
- Max Verstappen from Red Bull Racing is in the lead with the most points, showing great performance.
- Ferrari and Mercedes drivers, like Carlos Sainz, Charles Leclerc, George Russell, and Lewis Hamilton, also have strong points.
- Top Teams: Red Bull Racing, Ferrari, and Mercedes are the strongest teams with multiple high-scoring drivers.
- McLaren, with Lando Norris and Oscar Piastri, is competitive but slightly behind the top teams.
- Aston Martin, featuring Fernando Alonso and Lance Stroll, shows moderate performance in the midfield.
- Lower Points: Teams like Sauber and Alpine have fewer points, indicating they face challenges against the top teams.
- Struggling Teams: Drivers from Williams, Haas F1 Team, and RB are at the bottom of the points table.
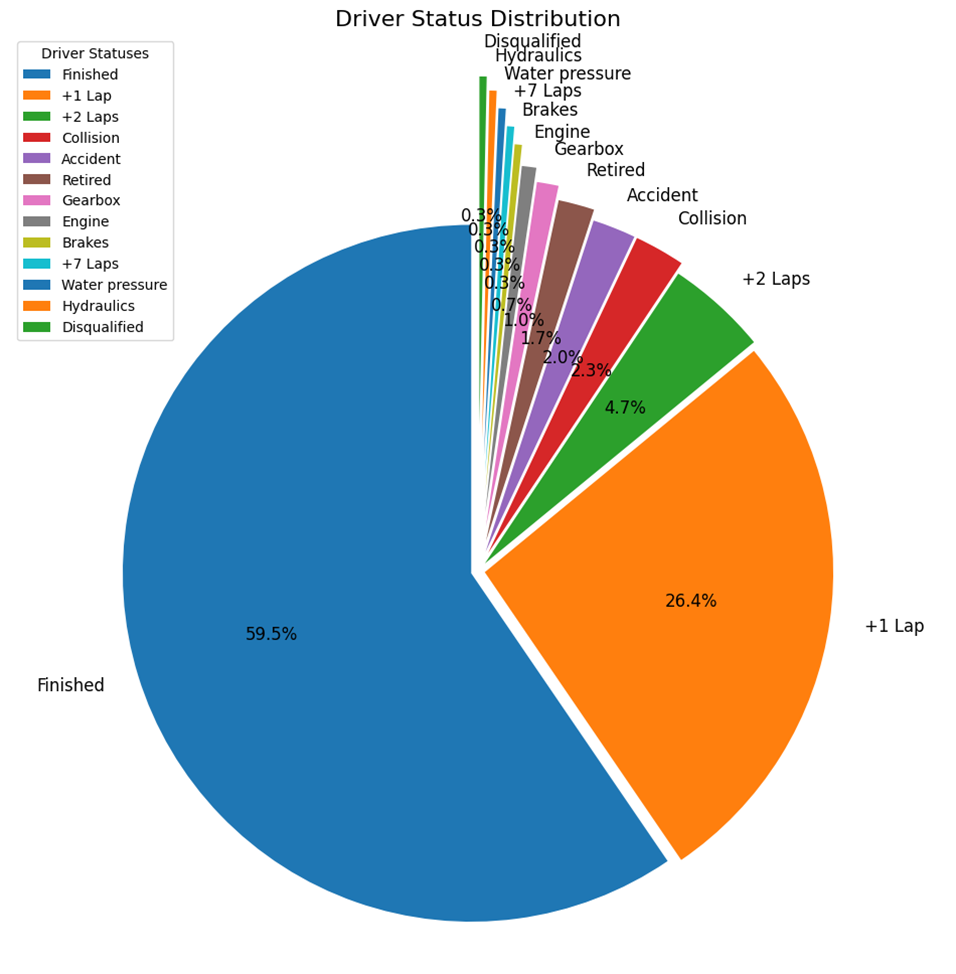
The pie chart shows the distribution of drivers’ statuses in all races. Here are the main points:
- 59.5% of the time, drivers finish the race.
- 26.4% of drivers complete at least one lap.
- Only 4.7% of the time do drivers complete the second lap.
- 4.3% of races involve accidents or collisions.
- Drivers retire from the race 1.7% of the time.
- Other issues like gearbox problems, +7 laps, and brake issues are each less than 1%.
Overall, most drivers finish their races, with only a small number facing accidents or retirements.
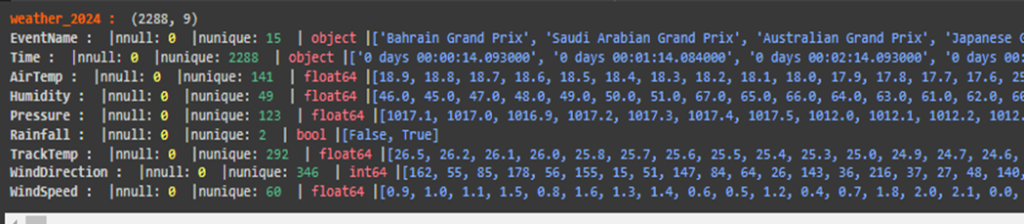
2024 Races Weather Data :
Weather dataset contains 2288 rows with 9 columns all fully populated. This dataset reports the weather of each events.
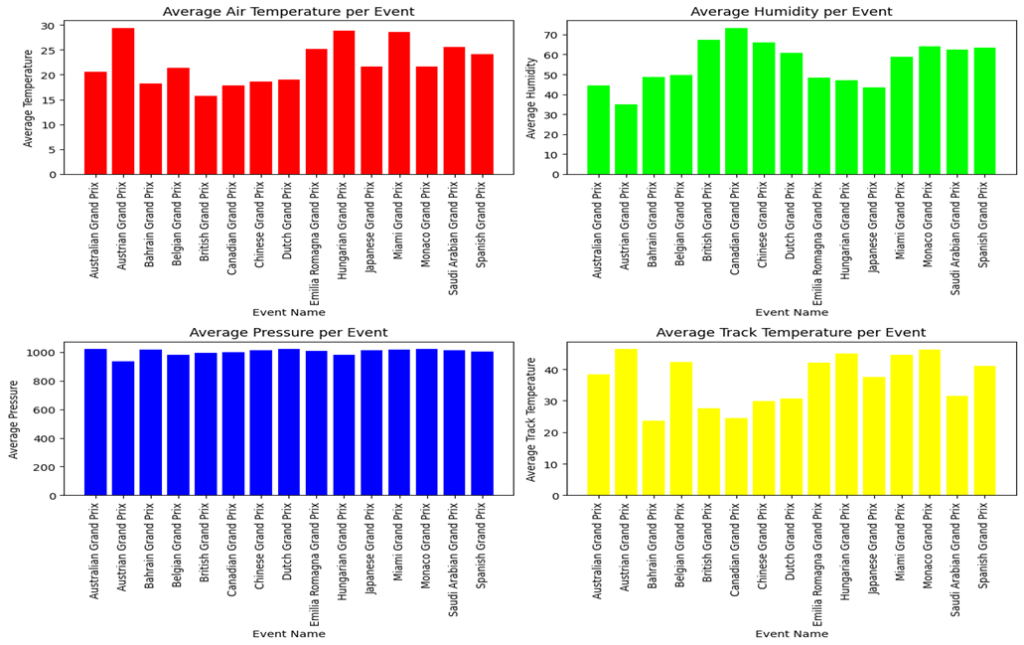
1.Average Air Temperature per Event:
- Temperatures vary across events, with some like the Bahrain Grand Prix showing higher averages.
- The Australian, Miami, and Saudi Arabian Grand Prix also have relatively high air temperatures.
2.Average Humidity per Event:
- Humidity is notably high at the Chinese and Japanese Grand Prix.
- Events like the Australian and Austrian Grand Prix have lower humidity levels.
3.Average Pressure per Event:
- Pressure remains relatively consistent across all events, with slight variations.
- There is no significant deviation, indicating stable atmospheric conditions.
4.Average Track Temperature per Event:
- Track temperatures are highest at the Bahrain and Saudi Arabian Grand Prix, paralleling higher air temperatures.
- Lower track temperatures are observed at events like the British and Belgian Grand Prix.

That’s it 😀 … We are officially done with the dataset overview !! We will get to EDA and Relationships in the next post