What is Pneumothorax and how can data science help?
Pneumothorax refers to the presence of air in the pleural space, between the lung and the chest wall. This causes collapsed lung, because thus the dilation of the chest wall would not involve the dilation of the lung. Shortness of breath, pain in the chest can be symptoms, the level of severity can vary.Experts say this disease can be identified from chest x-ray images, and here comes in the data science.
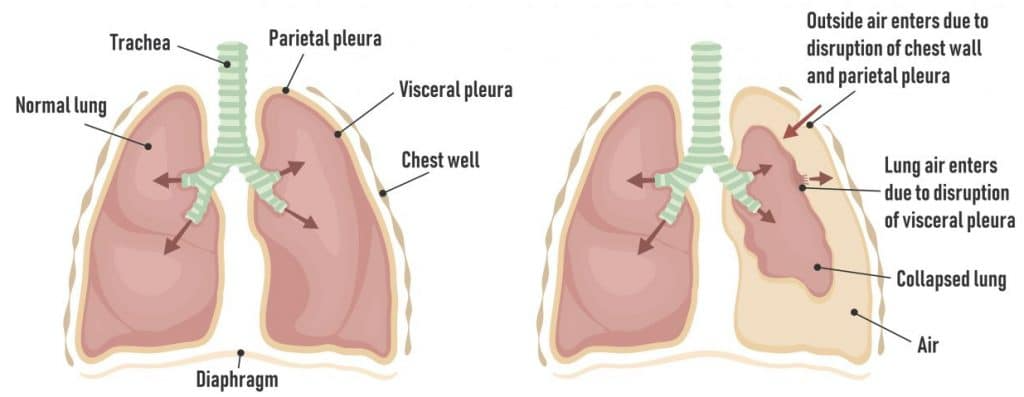
Using a dataset with x-ray images and their diagnosis with the exact place of the air in pleura, a model could be trained to recognize Pneumothorax. Additional information about the patients could also be useful when analyzing an x-ray image.
This competition held out by Kaggle community hosted by Society for Imaging Informatics in Medicine (SIIM) and American College of Radiology (ACR) and is available at here.
“The complete source code for this project is available in this GitHub repository. This approach achieved a private score of 0.80 on the Kaggle competition leaderboard.”
Data Overview
Data Overview and EDA is derived from the excellent work of retyidoro
The main folder contains two subfolders: train and test, and a csv file with the train labels.
The train and test folders contain DICOM (Digital Imaging and Communications in Medicine) formatted files, for some reason every single image is embedded in two more folders.
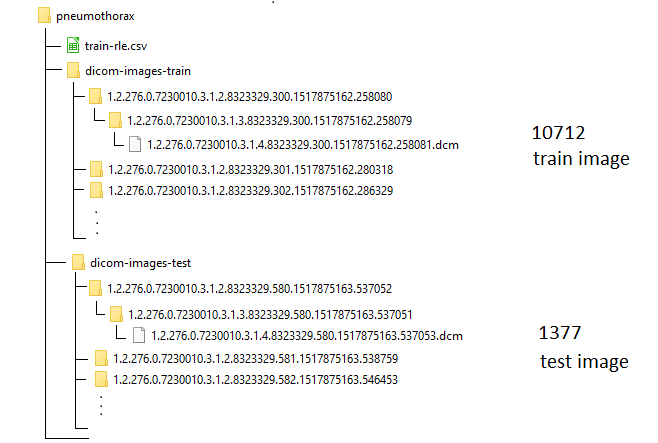
To be able to work with DICOM files I used pydicom python library for reading these files. As we can see below, a lot of metadata are available beside the x-ray image, but only a few of them may be useful for us.
(0008, 0005) Specific Character Set CS: ‘ISO_IR 100’
(0008, 0016) SOP Class UID UI: Secondary Capture Image Storage
(0008, 0018) SOP Instance UID UI: 1.2.276.0.7230010.3.1.4.8323329.1000.1517875165.878027
(0008, 0020) Study Date DA: ‘19010101’
(0008, 0030) Study Time TM: ‘000000.00’
(0008, 0050) Accession Number SH: ”
(0008, 0060) Modality CS: ‘CR’
(0008, 0064) Conversion Type CS: ‘WSD’
(0008, 0090) Referring Physician’s Name PN: ”
(0008, 103e) Series Description LO: ‘view: PA’
(0010, 0010) Patient’s Name PN: ’17d405a3-a0d2-4901-b33a-63906aa48d9f’
(0010, 0020) Patient ID LO: ’17d405a3-a0d2-4901-b33a-63906aa48d9f’
(0010, 0030) Patient’s Birth Date DA: ”
(0010, 0040) Patient’s Sex CS: ‘M’
(0010, 1010) Patient’s Age AS: ’38’
(0018, 0015) Body Part Examined CS: ‘CHEST’
(0018, 5101) View Position CS: ‘PA’
(0020, 000d) Study Instance UID UI: 1.2.276.0.7230010.3.1.2.8323329.1000.1517875165.878026
(0020, 000e) Series Instance UID UI: 1.2.276.0.7230010.3.1.3.8323329.1000.1517875165.878025
(0020, 0010) Study ID SH: ”
(0020, 0011) Series Number IS: “1”
(0020, 0013) Instance Number IS: “1”
(0020, 0020) Patient Orientation CS: ”
(0028, 0002) Samples per Pixel US: 1
(0028, 0004) Photometric Interpretation CS: ‘MONOCHROME2’
(0028, 0010) Rows US: 1024
(0028, 0011) Columns US: 1024
(0028, 0030) Pixel Spacing DS: [‘0.168’, ‘0.168’]
(0028, 0100) Bits Allocated US: 8
(0028, 0101) Bits Stored US: 8
(0028, 0102) High Bit US: 7
(0028, 0103) Pixel Representation US: 0
(0028, 2110) Lossy Image Compression CS: ’01’
(0028, 2114) Lossy Image Compression Method CS: ‘ISO_10918_1’
(7fe0, 0010) Pixel Data OB: Array of 130476 elements
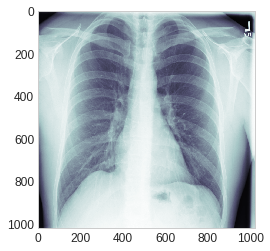
To facilitate the work I built pandas DataFrame for each of the test and train set filled with useful metadata of DICOM file , the XRay image addresses and the encoded RLE mask of each chest image if involved with Pneumothorax.
| UID | EncodedPixels | Age | Sex | Modality | BodyPart | ViewPosition | path | class | |
|---|---|---|---|---|---|---|---|---|---|
| 0 | 1.2.276.0.7230010.3.1.4.8323329.1000.151787516… | -1 | -0.529897 | 0.902591 | CR | CHEST | -0.803883 | /kaggle/input/datasets/jesperdramsch/siim-acr-… | 0 |
| 3 | 1.2.276.0.7230010.3.1.4.8323329.10002.15178752… | 338106 1 1019 4 1017 6 1016 8 1015 8 1014 9 10… | -1.107922 | CR | CHEST | 1.243963 | /kaggle/input/datasets/jesperdramsch/siim-acr-… | 0 |
the csv with the labels: -1 means no Pneumothorax, othervise there is an encoding for the place of Pneumothorax
Exploratory Data Analysis
There are a bit more of men, so in proportion with that, there are a bit more men with Pneumothorax than women.

We also know the age of patients, so let’s see the age distribution. To create a histogram, we have to know the maximum ages, for example by sorting.
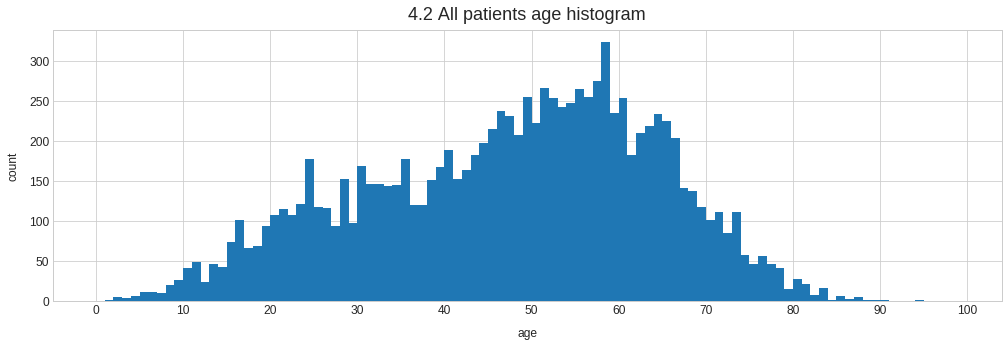
it’s seems there are some outliers in the dataset, 413 is far to old, and the 148 is also unbelivable. For the histogram, I will skip these two values.
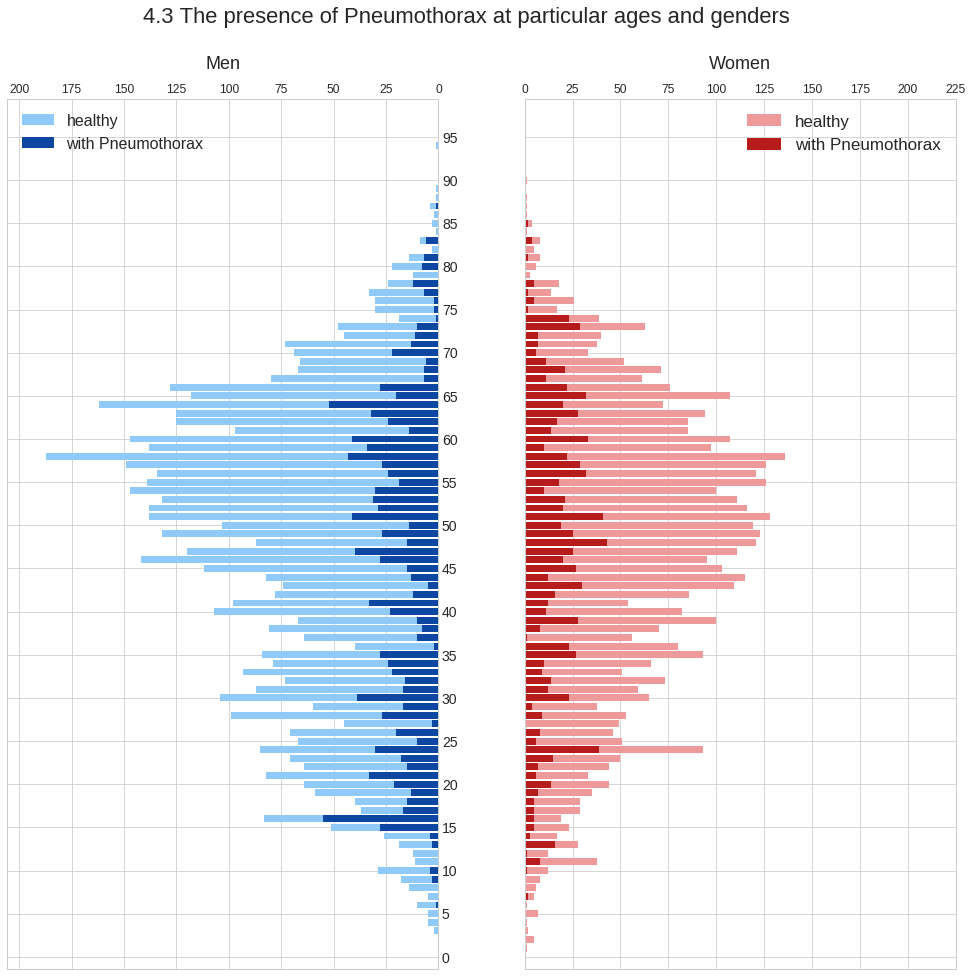
Looking at the histogram image, it is striking that many 16-year-old boys suffer from Pneumothorax, even more than the 64 years old men. The result seems unexpected, but if we read more about the disease, it turns out that the young, tall and thin men are more vulnerable. Young women in their twenties don’t seem to be an exception. However this information is based only on a small amount of data.
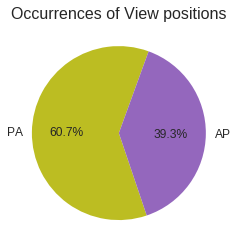
Among train set 6507 samples are taken with PA modality and 4205 sample are AP modality. Modalities refer to the way of x-ray in the body:
AP: passes from anterior of the body to posterior –> getting better posterior shaginds
PA: passes from posterior of the body to anterior –> getting better anterior shadings
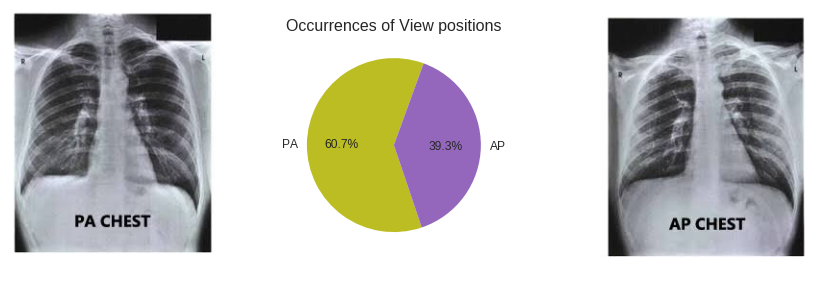
AP view is suaully used for x-rays, but in the case of the chest x-rays are rather taken from the PA view. If the health level of the patient does not allow to do PA, AP can also help.
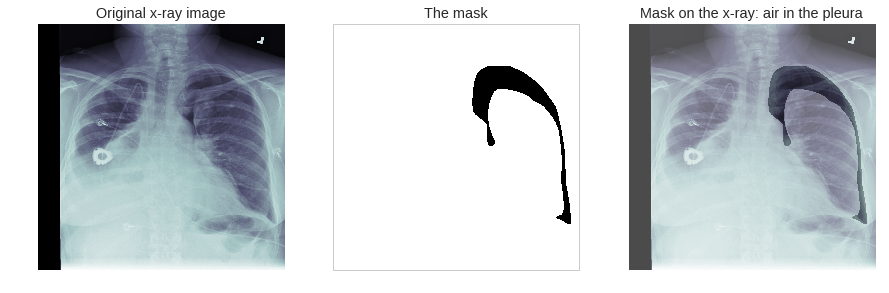
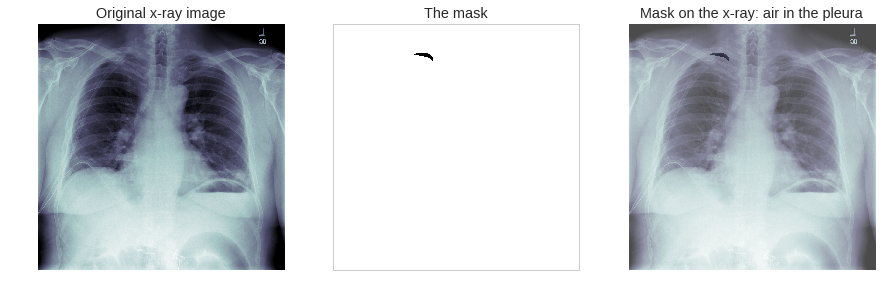
To visualize the masks on positive images we used helper function rle2mask to convert encoded mask to binary numbers where 0s are black pixels (existence of air ) and 1s are white pixels (clean area). Here are two examples of the encoded pixels. The rle2mask function returns a filter which has the same size as the original image. Some rotation and mirroring were needed, to place the mask correctly.
To get a general insight into the location of Pneumothorax, we can create some “lung heatmaps” for AP and PA views. Of course, every patient is different, thus the size of the lungs and their place on the x-ray image can be different. However, a heatmap may give an overview.
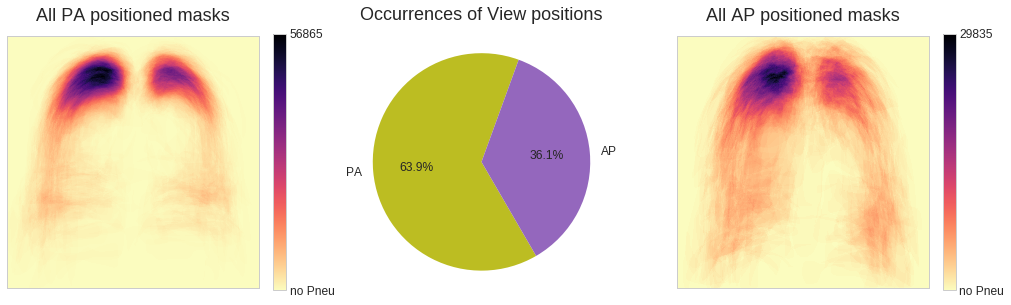
It seems that in both cases the top left corner of the lung is the most common location. In the PA cases, the x-ray images create a cleaner view, the lungs are outlined, while the general lungs of AP cases are noisier and have orange tone. From the colorbar can be read the maximum number of overlapped pixels.
Model
An AI pipeline that looks at a chest X-ray and answers two questions:
- Does this X-ray show a pneumothorax (a collapsed lung)?
- If yes, exactly where in the image is it?
The Big Idea:

Why two stages instead of one model that does everything?
- Most chest X-rays in this dataset are healthy. Asking a model to precisely outline “where” a disease is on an image that doesn’t have the disease wastes computation and gives it more chances to hallucinate a wrong region.
- Stage 1 is a fast, cheap filter: healthy vs. not-healthy.
- Stage 2 is a slower, more careful cartographer that only ever runs on the images Stage 1 flagged, so it can spend all its effort drawing an accurate outline.
This is a very common pattern in medical imaging AI, sometimes called a “detect-then-segment” or “gate-then-refine” pipe
Stage 1 — The Classifier: “Is anything wrong here?”
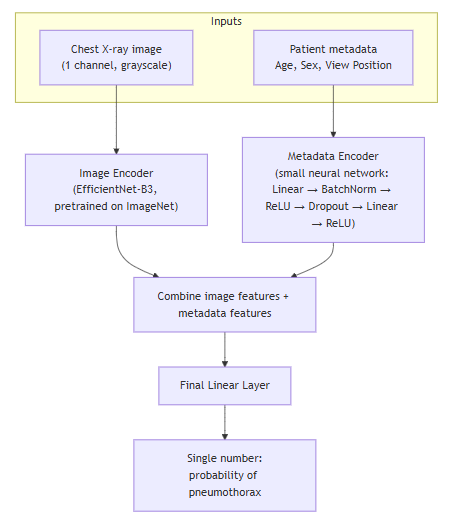
- The image encoder is EfficientNet-B3, a well-known, efficient convolutional network. It’s “pretrained,” meaning it already knows how to recognize general shapes and textures from millions of everyday photos before ever seeing an X-ray — this head start (transfer learning) means the model needs far less X-ray data to learn well.
- The metadata encoder is a tiny neural network that processes three numbers: the patient’s age, sex, and which direction the X-ray was taken from (AP = “front-facing, often for very sick/bedridden patients” vs. PA = “standard standing X-ray”). These details genuinely correlate with pneumothorax risk in the data, so feeding them in alongside the image gives the model extra clues a pure image model wouldn’t have.
- The two streams of information (image + metadata) are concatenated (“fused”) and passed through one final layer that outputs a single number: how confident the model is that this X-ray shows a pneumothorax.
- The best Threshold of this stage is obtained by finding the threshold that maximizes the F2 score (in medical imaging Recall is more important metric than Precision so instead of F1 score I used F2 score which gives a double weight to recall). The optimal threshold is 0.45
Stage 2 — The Segmentor: “Where exactly is it?”
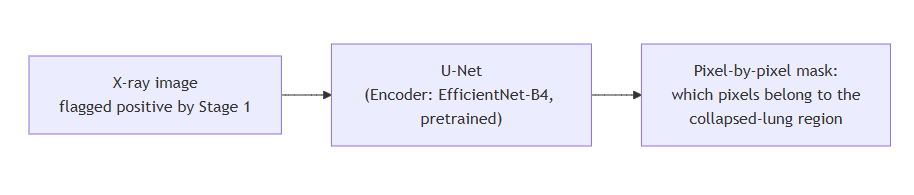
- This uses a U-Net, the standard architecture for “outline the exact shape of something” tasks in medical imaging. A U-Net first shrinks the image down to understand what is in it (using an EfficientNet-B4 encoder, again pretrained), then expands it back up to full resolution to decide, pixel by pixel, where it is.
- It only ever processes images that Stage 1 already flagged as positive — it never wastes effort on X-rays that are probably healthy.
- The output isn’t a single number like Stage 1 — it’s a full-resolution map the same size as the input image, where each pixel gets a score for “does this pixel belong to the pneumothorax region?”
Interpretation
How good is the classifier, really?
This loads the trained classifier and segmentor, runs them on a held-out validation set (X-rays the model never trained on), and computes a confusion matrix: how many true positives, false positives, true negatives, and false negatives there were, plus precision and recall.
In a medical screening context, recall (how many actual pneumothorax cases the model catches) usually matters more than raw accuracy — missing a real case is a far more costly mistake than a false alarm.
Here is the result of confusion matrix over holdout data with 276 samples with classifier threshold = 0.45
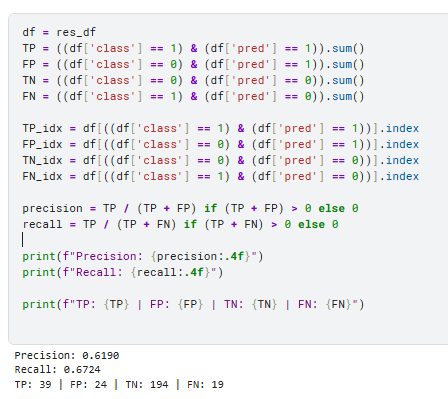
Precision (0.6190): Of predicted positives, 61.9% were correct. TP/(TP+FP) = 39/(39+24).
Recall (0.6724): Of actual positives, 67.2% were caught. TP/(TP+FN) = 39/(39+19).
Confusion matrix:
FN (19): Missed positives (down from 34)
TP (39): Correctly caught positives (up from 24)
FP (24): False alarms (up from 9)
TN (194): Correctly rejected negatives (down from 209)
Looking at the model’s mistakes
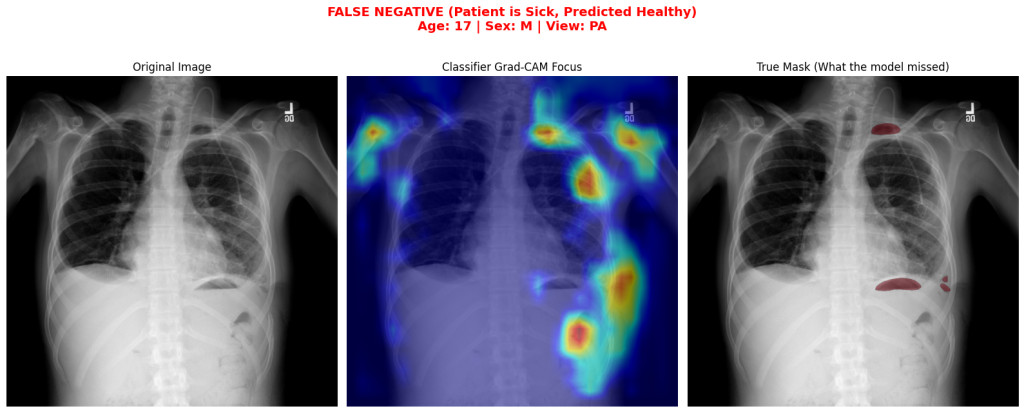
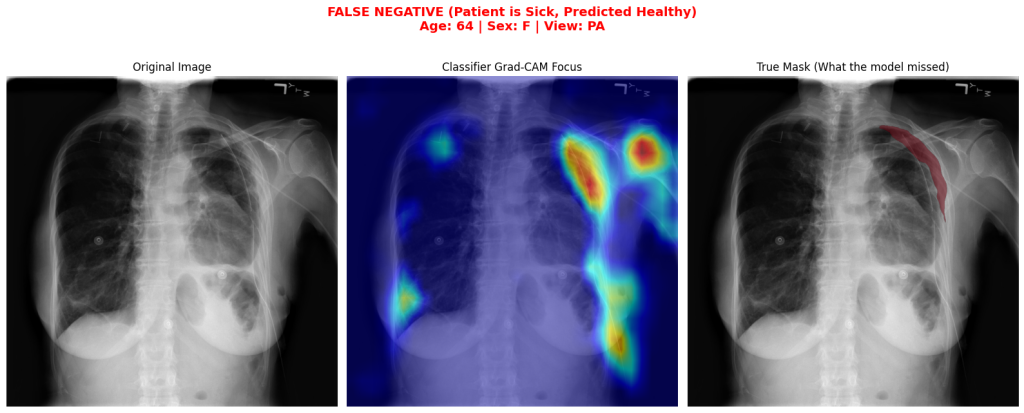
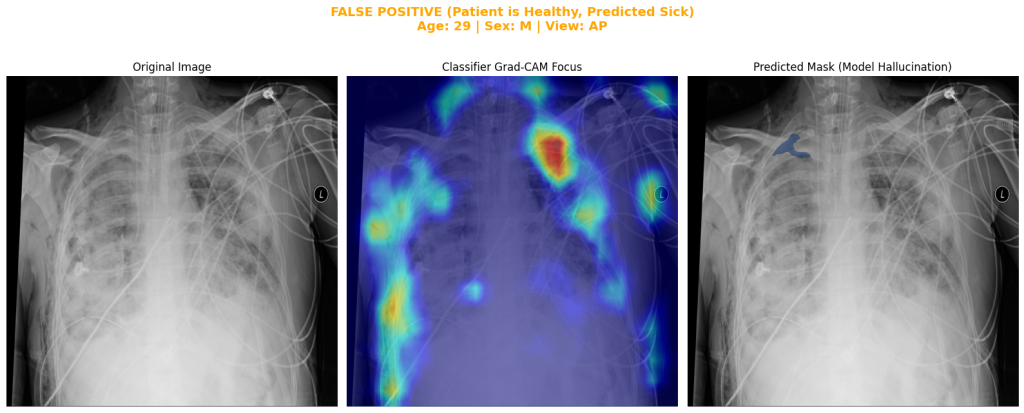
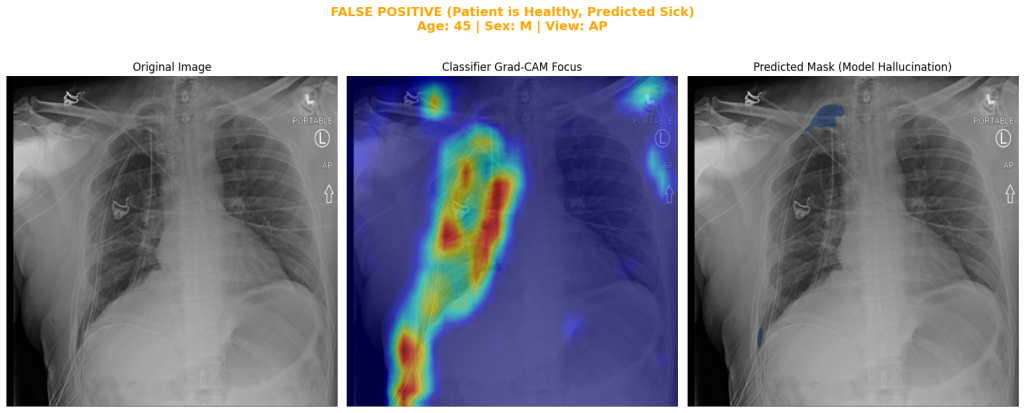
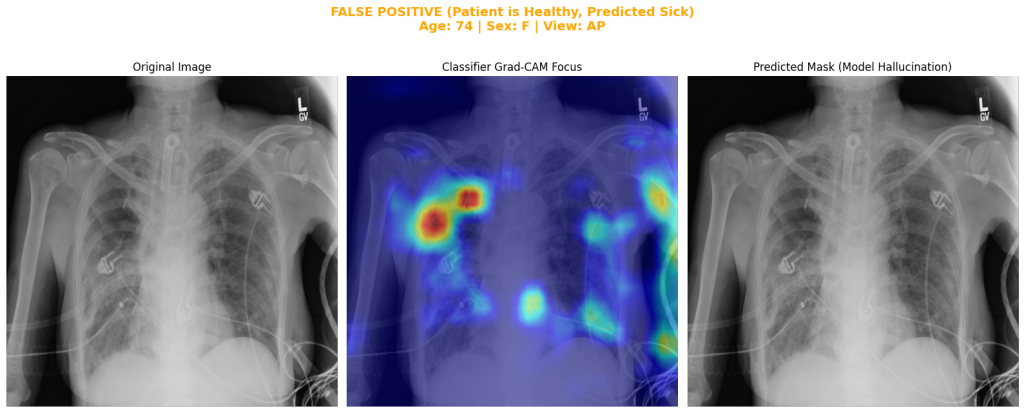
This is where the project gets genuinely interpretable. It uses a technique called Grad-CAM, which produces a heatmap over the X-ray showing which regions of the image most influenced the model’s decision — like a spotlight showing where the model was “looking.” For each mistake the classifier made, the notebook shows a 3-panel comparison:
- The original X-ray
- The Grad-CAM heatmap (where the model focused)
- The relevant mask — for a missed case (false negative), the true location of the pneumothorax it failed to notice; for a false alarm (false positive), the model’s own hallucinated prediction
This lets us visually check things like: “did the model miss this case because the pneumothorax was very small and subtle, or was it looking at a completely irrelevant part of the image?” That distinction matters a lot for deciding how to improve the model next. Here are a few False Negative and False Positive Predicted Samples :







==================================================
 ⚠️ FALSE POSITIVE (FP) METADATA
    (Patient is Healthy, Predicted Sick)
==================================================
[1/24] DF Idx: 18 | Age: 51 | Sex: F | View: AP
[2/24] DF Idx: 29 | Age: 11 | Sex: F | View: AP
[3/24] DF Idx: 34 | Age: 42 | Sex: F | View: AP
[4/24] DF Idx: 37 | Age: 61 | Sex: M | View: AP
[5/24] DF Idx: 46 | Age: 47 | Sex: F | View: AP
[6/24] DF Idx: 47 | Age: 19 | Sex: M | View: PA
[7/24] DF Idx: 49 | Age: 41 | Sex: M | View: PA
[8/24] DF Idx: 81 | Age: 57 | Sex: M | View: AP
[9/24] DF Idx: 89 | Age: 29 | Sex: M | View: AP
[10/24] DF Idx: 92 | Age: 68 | Sex: F | View: AP
[11/24] DF Idx: 102 | Age: 72 | Sex: F | View: AP
[12/24] DF Idx: 107 | Age: 20 | Sex: M | View: AP
[13/24] DF Idx: 118 | Age: 76 | Sex: F | View: AP
[14/24] DF Idx: 130 | Age: 74 | Sex: F | View: AP
[15/24] DF Idx: 159 | Age: 24 | Sex: M | View: PA
[16/24] DF Idx: 160 | Age: 21 | Sex: M | View: PA
[17/24] DF Idx: 170 | Age: 29 | Sex: M | View: AP
[18/24] DF Idx: 179 | Age: 69 | Sex: F | View: AP
[19/24] DF Idx: 197 | Age: 58 | Sex: F | View: AP
[20/24] DF Idx: 213 | Age: 45 | Sex: M | View: AP
[21/24] DF Idx: 227 | Age: 75 | Sex: M | View: AP
[22/24] DF Idx: 231 | Age: 70 | Sex: F | View: AP
[23/24] DF Idx: 241 | Age: 42 | Sex: M | View: AP
[24/24] DF Idx: 267 | Age: 50 | Sex: M | View: PA

==================================================
 ⚠️ FALSE NEGATIVE (FN) METADATA
    (Patient is Sick, Predicted Healthy)
==================================================
[1/19] DF Idx: 16 | Age: 34 | Sex: M | View: PA
[2/19] DF Idx: 28 | Age: 60 | Sex: M | View: PA
[3/19] DF Idx: 30 | Age: 51 | Sex: M | View: PA
[4/19] DF Idx: 31 | Age: 51 | Sex: F | View: AP
[5/19] DF Idx: 42 | Age: 48 | Sex: F | View: PA
[6/19] DF Idx: 62 | Age: 59 | Sex: F | View: PA
[7/19] DF Idx: 72 | Age: 33 | Sex: F | View: PA
[8/19] DF Idx: 83 | Age: 46 | Sex: F | View: PA
[9/19] DF Idx: 88 | Age: 52 | Sex: F | View: PA
[10/19] DF Idx: 108 | Age: 26 | Sex: F | View: PA
[11/19] DF Idx: 124 | Age: 18 | Sex: M | View: PA
[12/19] DF Idx: 141 | Age: 37 | Sex: M | View: PA
[13/19] DF Idx: 150 | Age: 50 | Sex: F | View: PA
[14/19] DF Idx: 174 | Age: 17 | Sex: M | View: PA
[15/19] DF Idx: 199 | Age: 39 | Sex: M | View: AP
[16/19] DF Idx: 204 | Age: 42 | Sex: F | View: AP
[17/19] DF Idx: 209 | Age: 64 | Sex: F | View: PA
[18/19] DF Idx: 217 | Age: 44 | Sex: M | View: PA
[19/19] DF Idx: 219 | Age: 39 | Sex: M | View: PA
These images indicates specific pattern about the performance of the model. Two scenario exists when the model predicts wrong:
- False Negative (FN) cases occur when the classifier classifies a positive image (sick patient) as negative (healthy), so the image is never passed to the second stage and the segmentor never processes it. Looking at these images, we can see that in most cases the classifier’s attention is actually focused on the correct region, but the predicted probability likely fell below the decision threshold, causing it to be classified as negative. Interestingly, 16 of the 19 FN cases are in the PA view, suggesting the classifier tends to associate the PA view with a negative (healthy) prediction. This is likely because the metadata fusion head has direct access to the view field, and in typical chest X-ray datasets, PA views are standard upright films for stable, ambulatory patients, while AP views are portable bedside films more common in sicker or immobile patients. As a result, the model may be partly using view position as a shortcut for the healthy/sick decision rather than relying solely on visual evidence.
- False Positive (FP) samples are cases the classifier inaccurately predicts as positive, causing them to be passed to the segmentor. Of the 24 images predicted as positive, 19 are in the AP view, suggesting the classifier tends to associate the AP view with a positive (sick) prediction, consistent with the same view-based bias described above. For most images in this category, the segmentor fails to find any affected region, resulting in an empty mask, or it segments only a small area as the affected region — which is expected, since these are false positives with no true pathology for the segmentor to find.
Confirming the model gets things right for the right reasons
Even when the model is correct, it’s worth checking why. This notebook takes the model’s true positives (cases it correctly flagged as pneumothorax) and shows a 4-panel view: the original image, the Grad-CAM attention heatmap, the true mask, and the predicted mask, side by side. The goal is to confirm the model’s attention actually overlaps with the real collapsed-lung region — rather than, say, getting the right answer by coincidentally focusing on a chest tube or hospital equipment that tends to appear alongside real pneumothorax cases in the training data (a classic way medical AI models can be “right for the wrong reason”).
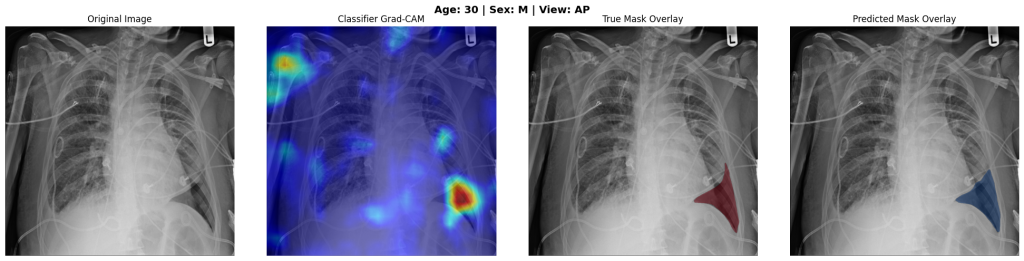
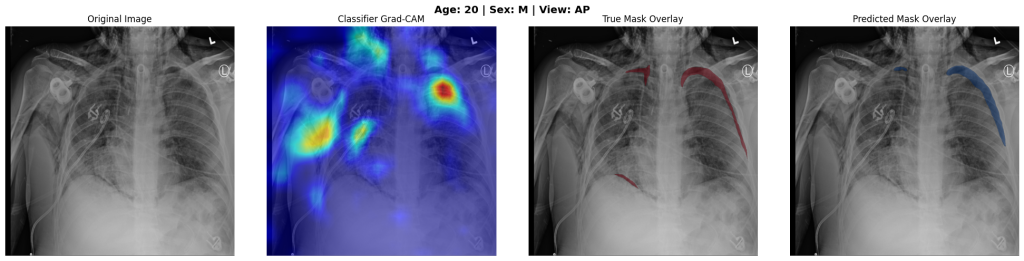


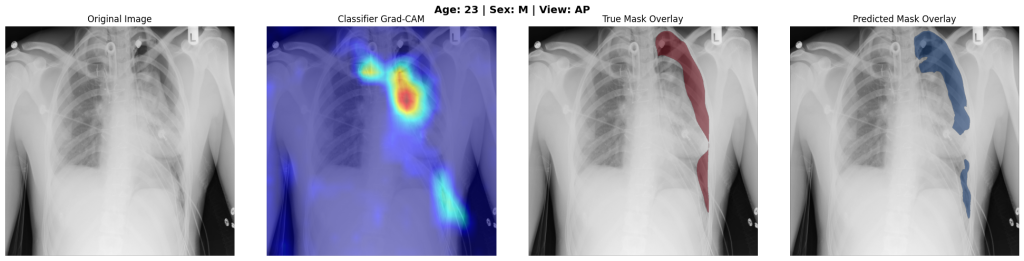


Looking at above images, the model could accurately predict the mask by looking at the right place of images. Heatmap images illustrate that the model knows where exactly to look and it doesn’t just guess the class by the looking at tags on the images or hospitals special image quality.
Deployment
I deployed A Gradio web app ( the simplest way to actually use the model ) to hugging face space. A user uploads a DICOM X-ray file and fills in age/sex/view position, and the app returns a plain-English diagnosis plus (if positive) a red overlay showing where the model thinks the pneumothorax is.
Here you can see and check the model prediction on the input dicom file of chest Xray